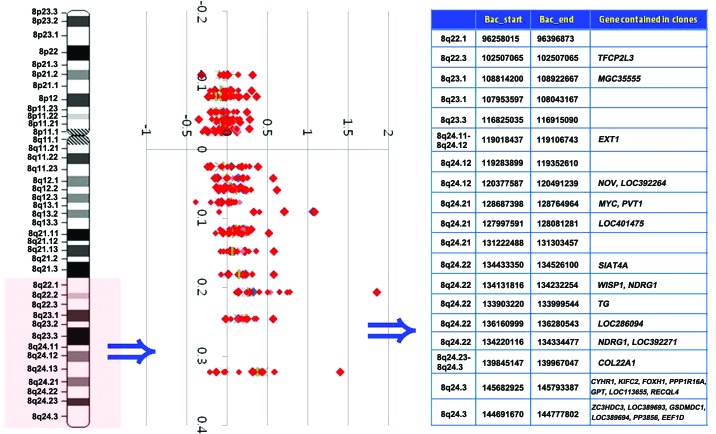
Figure 2.
Weighted frequency (%) diagram of the 8q22.1-q24.3 region in GC cases. In the intensity ratio profiles, the Y-axis represents the map position of the corresponding clone and the intensity ratios are assigned to the X-axis. Cytobands in the ideogram are shown on the left. Genes contained in clones are shown on the right. GC, gastric carcinoma; MYC, myelocytomatosis; PVT1, plasmacytoma variant translocation 1; CYHR1, cysteine/histidine rich 1; KIFC2, kinesin family member C2; FOXH1, forkhead box H1; PPP1R16A, protein phosphatase 1 regulatory subunit 16A; GPT, glutamic-pyruvate transaminase; RECQl4, RecQ protein-like 4.

