Abstract
In this paper we present first-of-its-kind spatially resolved enhancement kinetics of optical and magnetic resonance (MR) agents obtained by a combined MR and Diffuse Optical Tomography (MR-DOT) animal imaging system. A unique MR compatible fiber optic interface allows co-registration of MR and DOT data in space and time. High temporal resolution of the hybrid system permits acquisition of data in dynamic mode. Rats bearing a R3230 AC breast cancer tumor model are used for in vivo studies. Thirty-two optical and thirty MR images are acquired during a single imaging session that lasts nearly ten minutes. Both optical, indocyanine green (ICG), and MR contrast agents, gadolinium-DTPA (Gd-DTPA), are injected simultaneously after the acquisition of several baseline frames. Contrast enhancement time curves obtained by MR and DOT systems both indicate higher average enhancement in tumor regions, up to ten-fold for MRI and 3-fold for DOT, compared to close by non-tumor regions. This feasibility study is the first step towards clinical translation of this hybrid imaging platform. The ultimate aim is to use the enhancement kinetics of the optical agent ICG, which binds to plasma proteins, as complementary information to the kinetics of the MR agent Gd-DTPA, a small molecular agent that does not bind to plasma proteins, to better differentiate benign and malignant lesions.
Keywords: Diffuse Optical Tomography, DOT, MRI, Multimodality, Animal Imaging, Cancer, Reconstruction, ICG, gadolinium, Dynamic Contrast Enhanced Imaging
Introduction
Magnetic Resonance Imaging (MRI) has found significant use in cancer imaging due to its sensitivity. In breast cancer imaging, for example, several studies have shown sensitivities between 94 and 100% (1). Unfortunately, the specificity of MRI is not as high, with the reported values varying widely. The low specificity of MRI in cancer imaging frequently has resulted in many unnecessary biopsies. In dynamic contrast-enhanced MRI (DCE-MRI), the kinetics of the contrast agent gadolinium-diethylene-triamine-pentaacetic acid (Gd-DTPA) is used to improve specificity in differentiation of malignant lesions, as well as predict treatment response.
Even with the use of Gd-DTPA, however, the specificity remains only moderate due to significant overlap in enhancement between benign and malignant cancers (2). Gd-DTPA is a small molecular agent that readily crosses from vasculature into the extracellular space. This results in an overlap in enhancement. It has been shown that vascular permeability correlates with the rate of tumor growth, metastatic capacity, and tumor treatment response and that Gd-DTPA does not provide information about vascular permeability (3). Malignant tumors generally grow faster than benign lesions and would thus be expected to show higher vascular permeability. A larger contrast agent that mostly remains intravascular could be used to provide information about vascular permeability and thus better determine malignancy. Previous studies have looked at probing vascular permeability using contrast agents of different sizes. Yu et al., (4) and Su et al., (5–7) used MR contrast agents of two different sizes to determine vascular permeability. These studies concluded that using contrast agent of different sizes could be used to determine vascular permeability, which strongly correlates with tumor malignancy.
Since Gd-DTPA is the only available FDA-approved MR contrast agent, a second agent that can be detected by another imaging modality can be used to get additional information about vascular permeability. The optical agent Indocyanine green (ICG) has such potential. Upon injection, ICG is almost entirely bound to plasma proteins, mostly albumin. Because of this plasma protein binding, ICG acts as a low permeability agent, in contrast to the small molecular weight agent Gd-DTPA. This is a key distinction between the agents: ICG remains primarily in vasculature whereas gadolinium much more readily leaves the vasculature. Hence, ICG may be a better probe of vessel leakiness and tumor malignancy. It is FDA-approved and has already been used extensively for determining cardiac output, hepatic function, and liver blood flow, as well as for ophthalmic angiography (8, 9). It is almost entirely excreted in bile and has proven to be extremely safe.
We have previously used ICG and Gd-DTPA for a combined dynamic MRI and Diffuse Optical Spectroscopy (DOS) study of rat tumors, Cuccia et al., (10) In these studies, optical contrast agents were demonstrated to be useful for interrogation of tumor physiology and linked to tissue status as reflected by DCE-MRI enhancement levels. DOS, unfortunately, could only provide local measurements due to its single source-detector geometry with 5.7 mm separation. Recently, Hillman et al., investigated ICG kinetics in different organs using planar optical imaging (11). In this work we extend our dual modality approach to tomographic imaging that can provide cross-sectional ICG distributions with high temporal resolution.
Diffuse Optical Tomography (DOT) is an emerging medical imaging modality that uses near-infrared (NIR) light as a probe to ascertain tissue absorption and scattering properties (8). The principle absorbers in the NIR band are oxyhemoglobin, deoxyhemoglobin, fat, and water. Due to its sensitivity to both oxyhemoglobin and deoxyhemoglobin, DOT can be used to reveal tissue oxygenation in addition to overall absorption. This gives DOT the ability to obtain metabolic information without exogenous contrast. Meanwhile, optical contrast agents such as ICG provide exogenous contrast that can be used to enhance DOT imaging further.
Due to its capability of imaging both endogenous and exogenous contrast, DOT has been finding a niche in human brain and cancer imaging, as well as small animal tomography (12, 13). In cancer imaging, malignant lesions exhibit high hemoglobin and low oxygenation levels in DOT images. Several studies demonstrated that DOT has high sensitivity and specificity in cancer detection when the tumor size is around two centimeters.(14–16). Up to now, a few studies have also been performed using ICG-enhanced DOT for breast cancer imaging (12, 17, 18). They concluded that ICG dynamics may be a valuable tool for differentiating benign and malignant tumors.
In this work, for the first time, DCE-MRI and DCE-DOT are combined to simultaneously acquire spatially resolved Gd-DTPA and ICG kinetics in the same setting. Here, we report data from three different Fischer rats bearing R3230 AC mammary tumors. The objective of the study was to observe differences in the kinetics between Gd-DTPA and ICG in vivo and more importantly, to use a tomographic imaging technique that is sensitive to the whole volume within the optical imaging plane rather than local area under the optical probe to look at these kinetics in tumor and non-tumor regions.
Materials and Methods
This section describes the animals and tumor models, DOT system design and integration with MRI, data acquisition, as well as data calibration and analysis.
R3230 Breast Tumor Model
Tumor models are critical to testing imaging modalities for oncological imaging since they provide a relatively simple platform without the complexities, difficulties or expenses of human imaging. The R3230 AC tumor line is a transplantable adenocarcinoma specific to the Fischer rat. It is a lactating mammary tumor model that has been used previously as a breast cancer model (6, 19, 20). Fischer rats weighing approximately 170 g were used for this study. They were injected subcutaneously in the flank with R3230 AC adenocarcinoma cells. The imaging studies were performed when the tumor reached a size of approximately 1 cm.
MR-DOT System
We used a combined MR-DOT system that has previously been described in detail (21–23). This system used a series of eight source fibers to deliver light from laser diodes modulated at 100MHz to the animal being imaged. Meanwhile, eight detector fibers were used to detect transmitted light from the animal. The detector and source fibers were chosen as 1 mm step-index and 62.5 μm gradient-index fibers, respectively. An 8x32 fiber optic switch (Dicon Fiberoptic, GP700) was used to multiplex the laser diode outputs through the source fibers. Photomultiplier tubes (Hamamatsu R7400-20) were used at the multiple detection sites. The output of each PMT was amplified by a 65 dB rf-amplifier.
The earlier version of the system had temporal resolution of 220 seconds (22). However, in vivo studies in the literature showed that following the administration, the ICG concentration reached to its peak in nearly one minute (10, 17). To be able to monitor the enhancement kinetics of ICG, we recently increased the time resolution of our DOT system to 16 seconds using a heterodyne detection technique (23). The new version of the system recorded the output signals of the PMTs simultaneously using NI 4472 8-channel DAQ system after the down conversion of the signal frequency to 1 kHz. Figure 1 shows the schematic of the high-speed system that utilizes mixers and a frequency synthesizer (FS) for down conversion. In this new scheme, a Network Analyzer (NA) was used to generate the modulation signal. The computer adjusted the frequency of the NA and FS automatically to keep an offset of 1 KHz between them. Therefore, any desired modulation frequency could be set promptly per user’s request. Once recorded, the data was postprocessed to obtain 64 phase and 64 amplitude data which were used as an input for the DOT inverse solver.
Figure 1.
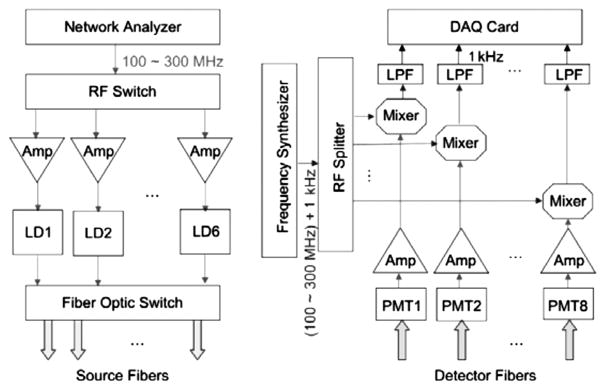
Schematic of the high speed multi-frequency modulation and detection circuitry.
The MRI setup consisted of a 4T magnet with a custom-built birdcage type RF coil which was built into the DOT interface. The MR console was developed by ISOL Technology. Fiber optic cables were passed through a waveguide in the RF-shielded MRI room to the control room, where the DOT detection unit and data acquisition hardware was located. For dynamic MR data acquisition, the time resolution was 23 seconds.
Data Acquisition
Five main sets of data were obtained for each animal. First, a calibration phantom was used for DOT calibration measurements. It was composed of solid epoxy with known absorption and scattering properties, (μa=0.0132 mm−1 and μs′=0.858 mm−1). These measurements were performed to account for systematic variations between source and detector channels as well as the errors due to data/model mismatch. Second, static DOT data was obtained and was meant to serve as a baseline for data processing. Third, dynamic DOT data was obtained with ICG enhancement. There were 32 frames in a single dynamic study and the ICG was generally injected after the fourth frame as a single bolus.
Likewise static and dynamic data was acquired with MRI for each animal. First, static T1 and T2-weighted images were acquired. The T1-weighted images generally showed a more solid border and were good for mesh generation. The T2-weighted images, on the other hand, were better for internal organ differentiation. Finally, dynamic T1-weighted MRI images were obtained. Five slices are obtained per frame and 30 frames in total were acquired with 23-second temporal resolution.
Data Calibration and Analysis
The dynamic enhancement curves for DOT and MRI images were measured from the selected ROIs. Two ROIs were chosen, the first to encompass the tumor and the second a non-tumor, muscle region in close proximity, as seen in MRI images. ROIs were co-registered between MRI and DOT. All data calibration and analysis was performed in MATLAB.
Once data was obtained, it underwent several steps of processing and screening for quality assurance. For DOT, these steps included raw data processing, calibration, mesh generation, reconstruction, and ROI selection and analysis. For MRI, the process was much simpler and included finding the co-registered MR/DOT slice, extracting the tumor boundary and selecting a nearby non-tumor, muscle region in the co-registered slice, estimating enhancement in both ROIs, getting the animal boundary for finite element (FEM) mesh generation.
Once a mesh was generated, reconstruction was performed using the calibrated data. A diffusion approximation to the radiative transfer equation was used to model the light propagation in the tissue. Once DOT reconstruction was performed the resulting μa and μs maps were converted from a FEM mesh to a rectangular grid that is the same size as the MRI data. This was done so that both datasets were co-registered and so that the ROI selected from MR data could also be used for DOT data.
For MRI data, ROIs were selected from a subtraction image of the frame, at the peak of enhancement, minus a baseline frame. This enhancement image was used to define tumor boundaries. The entire tumor was then selected as the first ROI. This same ROI was used for DOT data analysis. A non-tumor, muscle region was selected based on MRI images as the second ROI. In all three animals large muscle regions were found in close proximity to the tumor, providing a good reference region with relatively homogeneous enhancement. This ROI was also used for DOT data analysis. The mean values for the ROIs were then calculated, for each dynamic frame. For each ROI and contrast agent, the first measurement was subtracted from each of the other frames, to give a common starting point for both tumor and non-tumor regions.
The final dynamic enhancement curves were plotted for each modality and ROI, so that the kinetics could be compared.
Results
Results are shown for three animals. For each case the following images are shown: an anatomic T1-weighted MRI image with an MRI peak enhancement map overlay showing ROIs for tumor and non-tumor regions which were used for the data shown in curves; a peak ICG enhancement map; Gd-DTPA differential enhancement kinetics plot; and a plot of ICG differential enhancement kinetics. For case 1, additional images are shown, consisting of a baseline scattering image, the finite element (FEM) mesh used for reconstructing absorption and scattering maps, 5 frames of absorption enhancement maps, a baseline DOT absorption reconstruction, as well as an image showing the agar markers used for co-registering MRI and DOT data.
Case 1
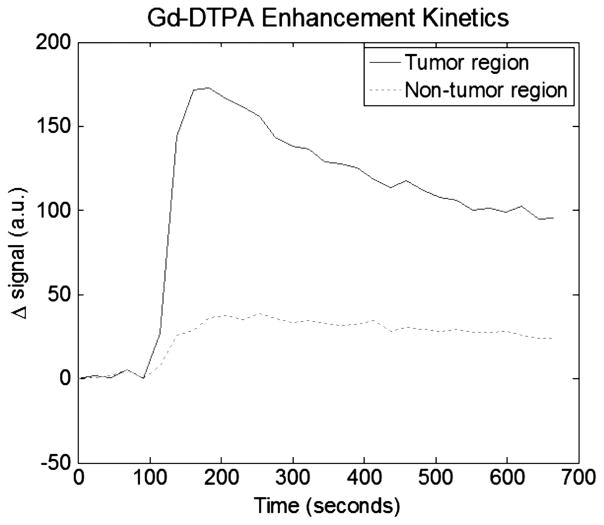
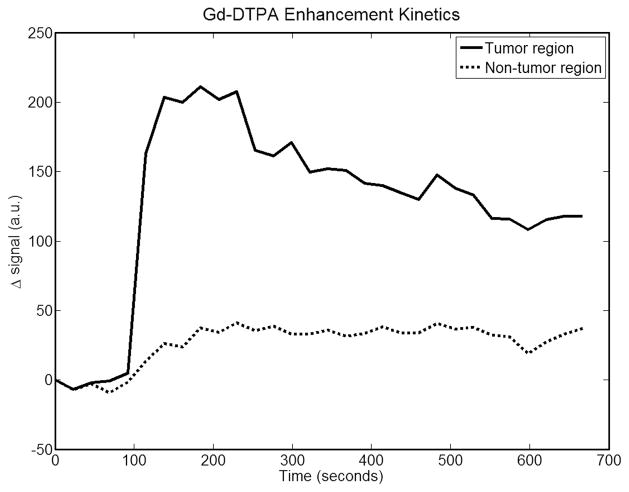
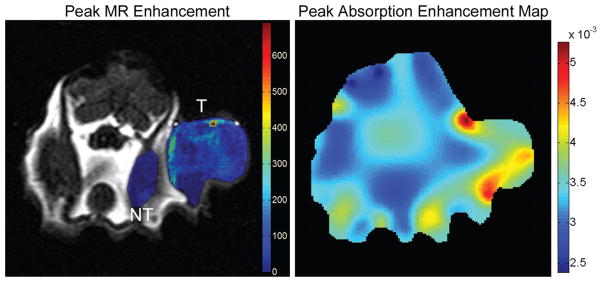
This animal has an approximately 1.5 cm tumor located on its right dorsal flank. Figure 2 is a T1-weighted anatomical MRI image used for generating an FEM mesh for DOT reconstruction. Also shown are the agar markers used to co-register MRI and DOT data. Figure 3 shows the peak MRI Gd-DTPA enhancement maps overlaid on top of the anatomic image for tumor and muscles regions. Meanwhile, these enhancement maps indicate as ROIs used for both MRI and DOT data analysis. The tumor ROI was chosen to cover the whole tumor. The non-tumor ROI was chosen to be roughly the same size as the tumor ROI, but in the closest muscle region. Figure 4 shows the Gd-DTPA enhancement kinetics for both regions. At maximum GD-DTPA enhancement the tumor to muscle contrast was nearly five.
Figure 2.
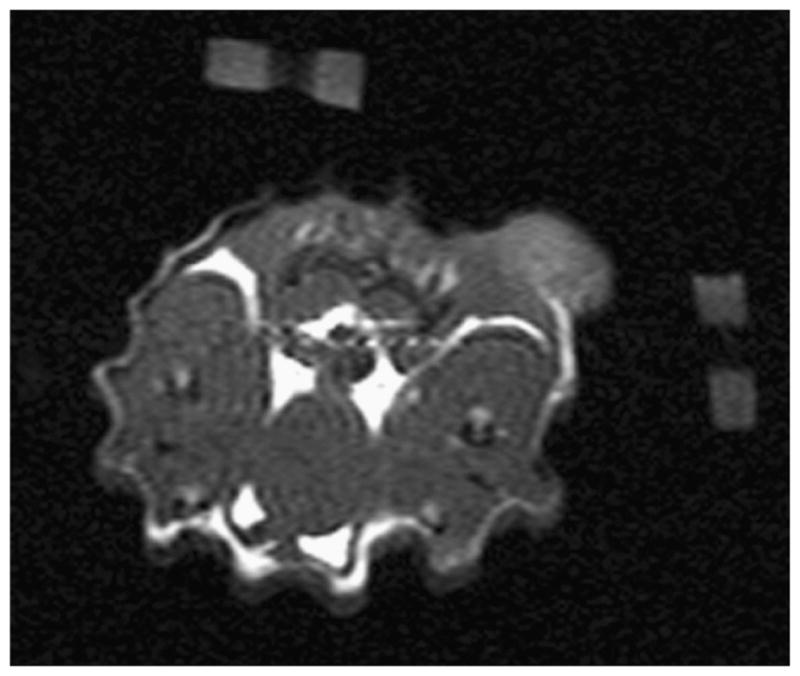
MRI anatomical image for case 1. This image shows the two fiducial markers made of agar used to co-register MRI and DOT measurements. These are removed from subsequent images after processing for clarity.
Figure 3.

Maximal Gd-DTPA MR enhancement for case 1 overlaid on anatomic image is shown on the left. The two ROIs can be seen (labeled “T” for tumor region and “NT” for non-tumor region). The region with higher enhancement, marked with “T”, is the tumor, the other highlighted region, marked with “NT”, is the non-tumor region. This figure also shows, on the right, the absorption enhancement map at maximal enhancement for case 1. This figure shows good tumor localization and contrast from surrounding tissue.
Figure 4.
Plot of Gd-DTPA differential enhancement kinetics for tumor and non-tumor regions for case1. Good contrast can be seen between the two regions.
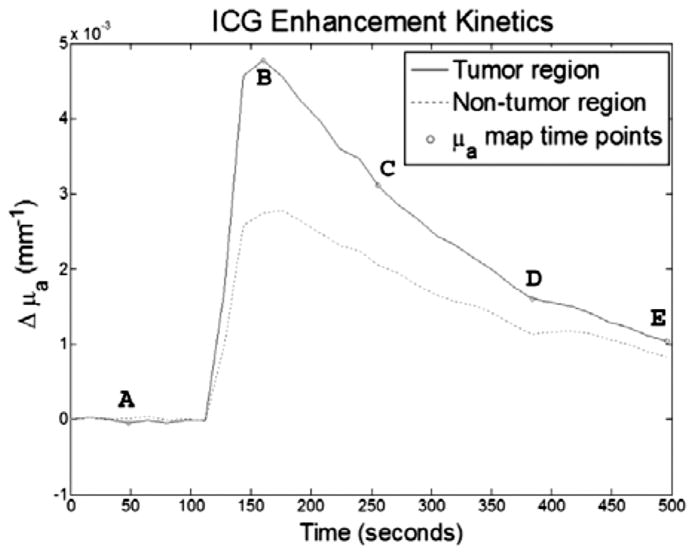
Figure 5 shows the FEM mesh generated from the anatomical MRI image. Figure 6 shows the baseline reconstructed absorption map. It is worth noting that absorption values are within expected values and agree with other literature values. Figure 7 shows enhancement maps at 5 selected time points. The tumor can clearly be seen as the enhancing region in the top right part of the animal. Figure 8 shows the ICG differential enhancement kinetics for both tumor and non-tumor regions. The 5 time points when the time-lapse images shown in Figure 7 are taken are marked on the time curve. In this case there is good contrast between tumor and non-tumor regions for both Gd-DTPA and ICG. At the peak, the overall change in the absorption value for tumor and muscle regions were 0.0048mm−1 and 0.0026mm−1, respectively. Please note that these are the mean values in the ROI. The maximum change in the absorption value for tumor and muscle regions were 0.0062 mm−1 and 0.003 mm−1, respectively. Accordingly, the tumor-to-muscle contrast actually increased slightly, if the maximum value in the ROI were used instead of the mean.
Figure 5.
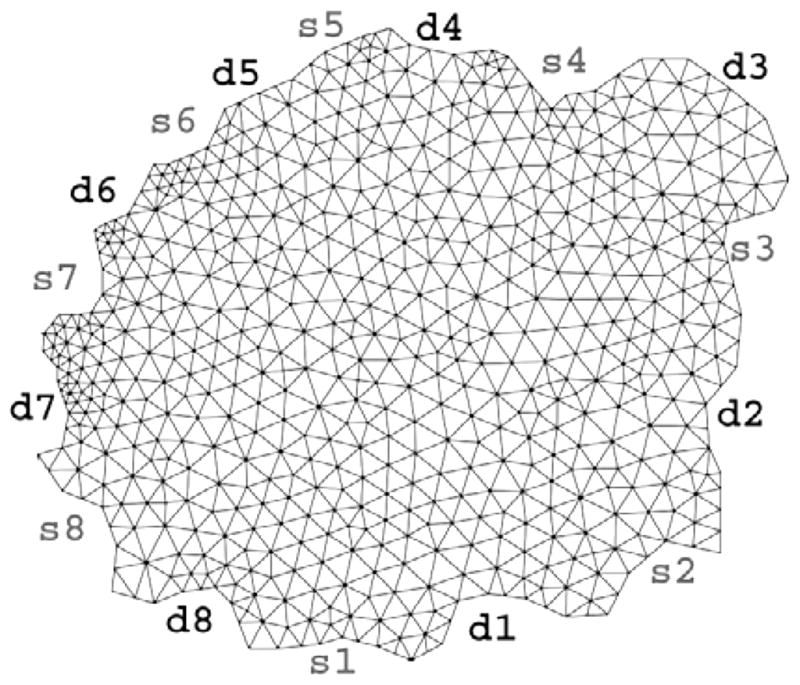
FEM mesh used for absorption and scattering map reconstructions for case 1. Source and detector positions are also marked on the mesh. Source positions and numbering are shown as s1–s8 while detector positions are indicated by d1 through d8.
Figure 6.

Baseline absorption and scattering maps (prior to contrast administration) for case 1.
Figure 7.

These five images show a time-lapse series of absorption enhancement for case 1. In the second frame the tumor can be clearly seen as the highest absorption area. The time points from which these plots are taken is indicated by the letters in Figure 8. These points were roughly even-spaced across the acquisition time.
Figure 8.
Plot of ICG kinetics for tumor and non-tumor regions, for case 1. The letters indicate from what time points the time-lapse images in Figure 7 were taken. Again, contrast can be seen between the tumor and non-tumor regions.
Case 2
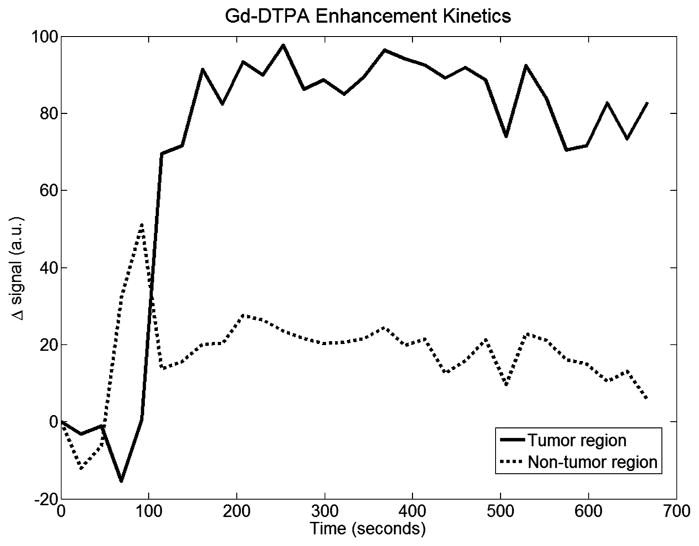
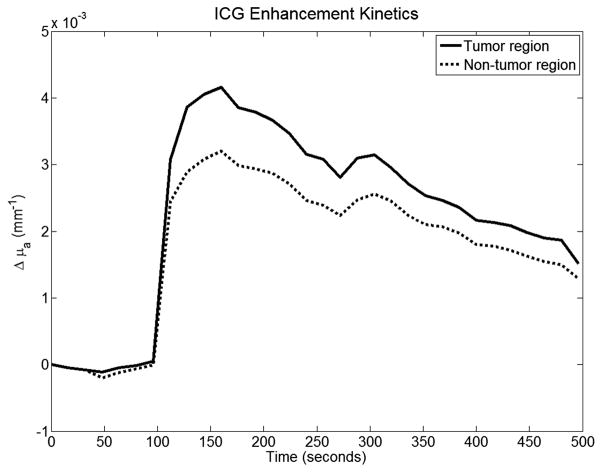
This animal has an approximately 2 cm tumor located on its right flank. Figure 9 shows the maximal Gd-DTPA enhancement frame overlaid on the anatomical T1-weighted MRI image. Here the tumor is significantly larger than case 1, but MRI enhancement is still clear. ROIs were chosen the same way as in the first case. Figure 10 shows the Gd-DTPA kinetics curves, with results similar to case 1. Again, the tumor to muscle contrast was high, nearly 5-fold for this particular case. The peak DOT enhancement map is shown in Figure 9. Figure 11 shows the ICG enhancement plots for both tumor and non-tumor regions. At the peak, the overall change in the absorption value for tumor and muscle regions were 0.0042 mm−1 and 0.0032 mm−1, respectively. The tumor to muscle contrast was lower than the first case most probably due to heterogeneity of the tumor. The contrast increased to 1.4 when the maximum change in the absorption value for tumor and muscle regions (0.005 mm−1 and 0.0036 mm−1) were used.
Figure 9.
On the left is shown the maximal Gd-DTPA enhancement for case 2 overlaid on anatomical image. Again, both the tumor and non-tumor ROIs can be seen and are labeled with “T” and “NT” respectively. The absorption enhancement map at peak enhancement, for case 2, is shown on the right.
Figure 10.
Gd-DTPA enhancement kinetics for case 2. This case also shows excellent contrast between tumor and background tissue.
Figure 11.
ICG kinetics plots for case 2. Contrast is not as good as the first case. Quick washout may indicate a predominantly intravascular mechanism of contrast enhancement.
Case 3
This animal has an approximately 1 cm tumor located on its right side. This tumor is much smaller than the other two and resulted in some complications in ROI selection. Figure 12 shows the peak Gd-DTPA enhancement map again for two distinct regions: tumor and muscle area. Figure 13 shows the mean Gd-DTPA enhancement kinetics for both regions. Again, enhancement is stronger in the viable tumor region compared to the non-tumor region and the overall tumor-to-muscle contrast was nearly 5-fold. The peak optical enhancement map is shown in Figure 12. Figure 14 shows the ICG differential enhancement kinetics. Similar to the previous cases, ICG enhancement is nearly 1.4 times higher in the tumor than the background.
Figure 12.

The maximal Gd-DTPA enhancement for case 3, overlaid on anatomical T1-weighted image is shown on the left. Both ROIs are shown and labeled. The absorption enhancement map at peak enhancement, for case 3, is shown on the right. Here, the tumor, although very small, is well localized. A few other high-absorption areas can also be seen.
Figure 13.
Gd-DTP kinetics plots for case 3. This data was a little noisier than the first two cases, but good contrast can be seen nonetheless.
Figure 14.
ICG kinetics plots for case 3. Once again contrast between the two regions can be clearly seen.
Discussion and Conclusions
In this paper, we presented spatially-resolved dynamic enhancement kinetics of an optical and MR agent acquired simultaneously in the same settings using several animals bearing R3230, a breast cancer tumor model. For this purpose combined MRI-DOT animal imaging system used. The significance of this study is three fold. First, the spatially resolved optical enhancement kinetics is obtained using a tomographic approach that is capable of generating axial absorption images. Secondly, the temporal resolution of the DOT system is high enough, 16 seconds, to be able to follow enhancement kinetics of ICG, which reaches to its peak in nearly one minute. Last but not least, the enhancement kinetics of both MR and optical contrast agents are acquired simultaneously in the same setting.
The results show good tumor localization with both DCE-MRI and DCE-DOT. Moreover, the baseline absorption values and changes in absorption with ICG administration fall within expected values reported earlier (10). There is a difference in enhancement strength between Gd-DTPA and ICG (i.e., tumor-muscle contrast is much higher in MRI results), which can be attributed to the effective size of the respective molecules and the relative leakiness of tumor blood vessels. As mentioned in the introduction, vessel leakiness is directly correlated with tumor malignancy and contrast agents of varying molecular weights can be used to probe this leakiness. This provides a possible tool for determining tumor malignancy and thus, patient prognosis. Because gadolinium is a very small agent (0.57kD), it tends to escape vasculature easily. The contrast between non-tumor regions and tumor regions indicates the leakiness of tumor vessels. Due to its albumin-binding property, ICG behaves like a low permeability agent (67kD), making it more difficult for ICG to leave the vasculature. The moderate enhancement contrast with ICG in this case may suggest that the R3230AC tumor has moderate leakiness. Additionally, larger weight contrast agents tend to show diminished enhancement compared with small molecular weight agents. This agrees with the results found by Su et al, (6). It should also be pointed out that the slow wash-out for some Gd-DTPA-enhanced tumors can be explained using a two-compartment model which consists of the vasculature as once compartment, and the interstitial space as another. Contrast agent material that leaks into the interstitial space will take longer to clear, resulting in a flatter washout.
It is worth noting that although experiments with ICG have been performed previously in breast cancer assessment, there has been no small animal studies combined with MRI and Gd-DTPA. The breast is a more ideal imaging medium for DOT than a typical small animal due to the relative homogeneity of the breast. Interestingly, the results from case 1 were better than either of the other two. This tumor was placed more caudally than in the other animals. Consequently, there were less hollow organs, which could cause some problems with DOT reconstruction due to modeling mismatch of either high absorption or very low scattering organs. To improve results it is possible to use a priori data from MRI to segment the animal into regions. This could provide a significant improvement in small animal imaging, since there are several different regions or organs easily visible on MRI in the typical small animal. Finally, we are trying to implement Radiative Transfer Equation into our FEM based modeling that should improve the results due to proper modeling of light propagation on heterogeneous medium such as animal tissue.
As a next step, we are planning to evaluate the performance of this approach using tumors with various levels of aggressiveness. Capability of obtaining simultaneous spatially resolved dynamic enhancement kinetics of optical and MR agents, raises the translational potential and significance of this system. Such a hybrid platform can also be applied for breast cancer imaging with proper modification. This powerful platform can provide additional ICG enhancement kinetic information and potentially improve the overall specificity MRI in differentiation of malignant and benign breast lesions. We are currently expanding this hybrid system for breast cancer studies and planning to start a limited clinical study in the near future.
Acknowledgments
The authors express thanks to Lena Qin for her hard work in providing and taking care of the animals used in this study. A special thanks also goes to Dr. Min-Ying Su for her help and insight, as well as to Seung Ha and Hon Yu for their help with data acquisition and MRI hardware. This research is funded by NIH grants R33 CA120175 and R21 CA 121568.
Abbreviations
- MRI
Magnetic Resonance Imaging
- DOT
Diffuse Optical Tomography; Dynamic Contrast-Enhanced Imaging
- Gd-DTPA
gadolinium- diethylene-triamine-pentaacetic acid
- ICG
indocyanine green
- DCE-MRI
Dynamic Contrast-Enhanced MRI
- NIR
Near Infrared
- PMT
Photo Multiplier Tube
- ROI
Region of Interest
- FEM
Finite Element Mesh
References
- 1.Eby PR, Lehman CD. Magnetic resonance imaging–guided breast interventions, Top. Magn Reson Imaging. 2008;19:151–162. doi: 10.1097/RMR.0b013e31818aade7. [DOI] [PubMed] [Google Scholar]
- 2.Turnbull LW. Dynamic contrast-enhanced MRI in the diagnosis and management of breast cancer. NMR Biomed. 2009;22:28–39. doi: 10.1002/nbm.1273. [DOI] [PubMed] [Google Scholar]
- 3.Su MY, Muhler A, Lao X, Nalcioglu O. Tumor characterization with dynamic contrast-enhanced MRI using MR contrast agents of various molecular weights. Magn Reson Med. 1998;39:259–269. doi: 10.1002/mrm.1910390213. [DOI] [PubMed] [Google Scholar]
- 4.Yu H, Su MY, Wang Z, Nalcioglu O. A longitudinal study of radiation-induced changes in tumor vasculature by contrast-enhanced magnetic resonance imaging. Radiat Res. 2002;158:152–158. doi: 10.1667/0033-7587(2002)158[0152:alsori]2.0.co;2. [DOI] [PubMed] [Google Scholar]
- 5.Su MY, Jao JC, Nalcioglu O. Measurement of vascular volume fraction and blood-tissue permeability constants with a pharmacokinetic model: studies in rat muscle tumors with dynamic Gd-DTPA enhanced MRI. Magn Reson Med. 1994;32:714–724. doi: 10.1002/mrm.1910320606. [DOI] [PubMed] [Google Scholar]
- 6.Su MY, Muhler A, Lao X, Nalcioglu O. Tumor characterization with dynamic contrast-enhanced MRI using MR contrast agents of various molecular weights. Magn Reson Med. 1998;39:259–269. doi: 10.1002/mrm.1910390213. [DOI] [PubMed] [Google Scholar]
- 7.Su MY, Najafi AA, Nalcioglu O. Regional comparison of tumor vascularity and permeability parameters measured by albumin-Gd-DTPA and Gd-DTPA. Magn Reson Med. 1995;34:402–411. doi: 10.1002/mrm.1910340318. [DOI] [PubMed] [Google Scholar]
- 8.FoxOX IJ, Brooker LG, Heseltine DW, Essex HE, Wood EH. A tricarbocyanine dye for continuous recording of dilution curves in whole blood independent of variations in blood oxygen saturation. Proc Staff Meet Mayo Clin. 1957;32:478–484. [PubMed] [Google Scholar]
- 9.Landsman ML, Kwant GG, Mook A, Zijlstra WG. Light- absorbing properties, stability, and spectral stabilization of indocyanine green. J Appl Physiol. 1976;40:575–583. doi: 10.1152/jappl.1976.40.4.575. [DOI] [PubMed] [Google Scholar]
- 10.Cuccia DJ, Bevilacqua F, Durkin AJ, Merritt S, Tromberg BJ, Gulsen G, Yu H, Wang J, Nalcioglu O. In vivo quantification of optical contrast agent dynamics in rat tumors by use of diffuse optical spectroscopy with magnetic resonance imaging coregistration. Appl Opt. 2003;42:2940–2950. doi: 10.1364/ao.42.002940. [DOI] [PubMed] [Google Scholar]
- 11.Hillman EM, Moore A. All-optical anatomical co-registration for molecular imaging of small animals using dynamic contrast. Nat Photonics. 2007;1:526–530. doi: 10.1038/nphoton.2007.146. [DOI] [PMC free article] [PubMed] [Google Scholar]
- 12.Ntziachristos V, Yodh AG, Schnall M, Chance B. Concurrent MRI and diffuse optical tomography of breast after indocyanine green enhancement. Proc Natl Acad Sci US A. 2000;97:2767–2772. doi: 10.1073/pnas.040570597. [DOI] [PMC free article] [PubMed] [Google Scholar]
- 13.Konecky SD, Panasyuk GY, Lee K, Markel V, Yodh AG, Schotland JC. Imaging complex structures with diffuse light. Opt Express. 2008;16:5048–5060. doi: 10.1364/oe.16.005048. [DOI] [PMC free article] [PubMed] [Google Scholar]
- 14.Ntziachristos V, Chance B. Probing physiology and molecular function using optical imaging: applications to breast cancer. Breast Cancer Res. 2001;3:41–46. doi: 10.1186/bcr269. [DOI] [PMC free article] [PubMed] [Google Scholar]
- 15.Van de Ven SM, Elias SG, van den Bosch MA, Luijten P, Mali WP. Optical imaging of the breast. Cancer Imaging. 2008;8:206–215. doi: 10.1102/1470-7330.2008.0032. [DOI] [PMC free article] [PubMed] [Google Scholar]
- 16.Luker GD, Luker KE. Optical imaging: current applications and future directions. J Nucl Med. 2008;49:1–4. doi: 10.2967/jnumed.107.045799. [DOI] [PubMed] [Google Scholar]
- 17.Intes X, Ripoll J, Chen Y, Nioka S, Yodh AG, Chance B. In vivo continuous-wave optical breast imaging enhanced with Indocyanine Green. Med Phys. 2003;30:1039–1047. doi: 10.1118/1.1573791. [DOI] [PubMed] [Google Scholar]
- 18.Alacam B, Yazici B, Intes X, Nioka S, Chance B. Pharmacokinetic-rate images of indocyanine green for breast tumors using near-infrared optical methods. Phys Med Biol. 2008;53:837–859. doi: 10.1088/0031-9155/53/4/002. [DOI] [PubMed] [Google Scholar]
- 19.Merritt S, Bevilacqua F, Durkin AJ, Cuccia DJ, Lanning R, Tromberg BJ, Gulsen G, Yu H, Wang J, Nalcioglu O. Coregistration of diffuse optical spectroscopy and magnetic resonance imaging in a rat tumor model. Appl Opt. 2003;42:2951–2959. doi: 10.1364/ao.42.002951. [DOI] [PubMed] [Google Scholar]
- 20.Hilf R, Michel I, Bell C, Freeman JJ, Borman A. Biochemical and Morphologic Properties of a New Lactating Mammary Tumor Line in the Rat. Cancer Res. 1965;25:286–299. [PubMed] [Google Scholar]
- 21.Gulsen G, Xiong B, Birgul O, Nalcioglu O. Design and implementation of a multifrequency near-infrared diffuse optical tomography system. J Biomed Opt. 2006;11:014020. doi: 10.1117/1.2161199. [DOI] [PubMed] [Google Scholar]
- 22.Gulsen G, Birgul O, Unlu MB, Shafiiha R, Nalcioglu O. Combined diffuse optical tomography (DOT) and MRI system for cancer imaging in small animals. Technol Cancer Res Treat. 2006;5:351–363. doi: 10.1177/153303460600500407. [DOI] [PubMed] [Google Scholar]
- 23.Unlu MB, Lin Y, Gulsen G. Dynamic contrast-enhanced diffuse optical tomography (DCE-DOT): experimental validation with a dynamic phantom. Phys Med Biol. 2009;54:6739–6755. doi: 10.1088/0031-9155/54/21/019. [DOI] [PMC free article] [PubMed] [Google Scholar]


