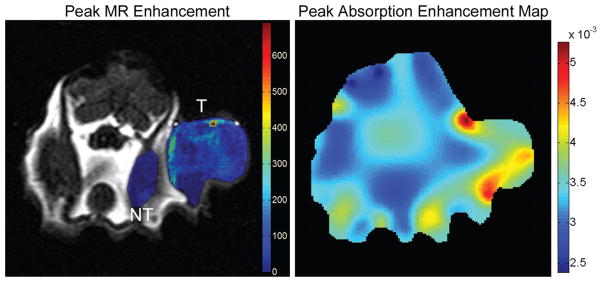
Figure 9.

On the left is shown the maximal Gd-DTPA enhancement for case 2 overlaid on anatomical image. Again, both the tumor and non-tumor ROIs can be seen and are labeled with “T” and “NT” respectively. The absorption enhancement map at peak enhancement, for case 2, is shown on the right.
