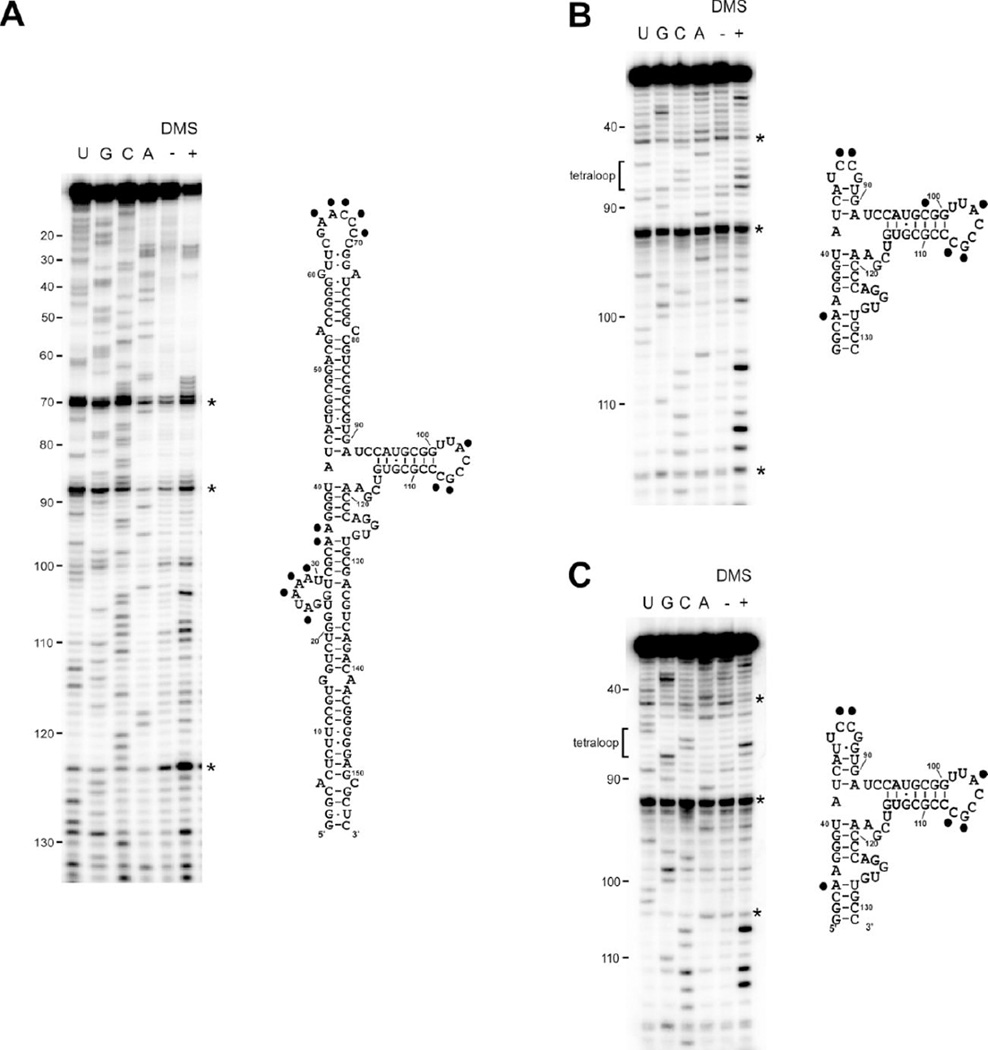
Figure 3.
DMS structure probing of VAI (A), CD1 (B) and CD2 (C). Gels are shown on the left and secondary structures diagrams are shown on the right with modified bases indicated by a black dot. Each gel includes a sequencing ladder, a control lane without DMS (−) and a lane with DMS (+). Artifacts arising from reverse transcriptase pause sites are marked with an asterisk.

