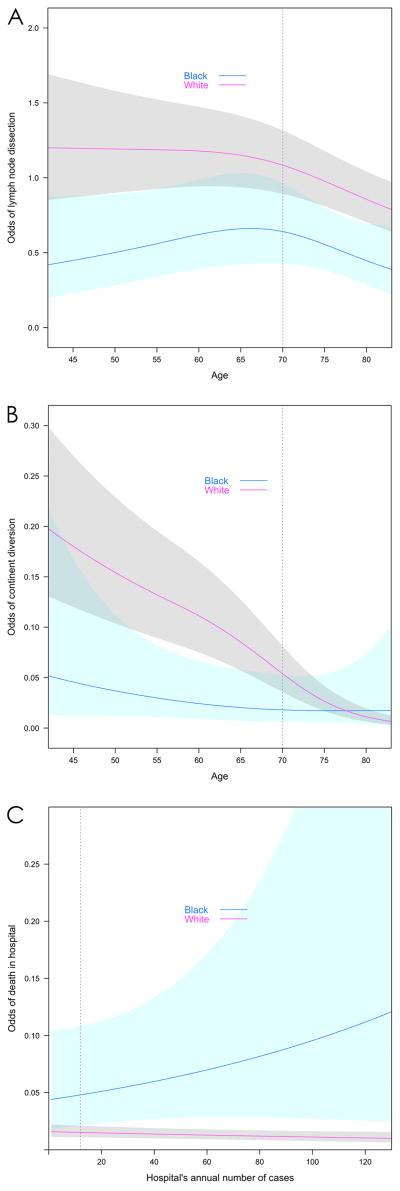
Figure 1. Model predictions based on race and interaction terms.
A. Odds of undergoing Pelvic Lymph Node Dissection by Race over Surgeon Volume
B. Odds of undergoing Continent Diversion by Race over Age
C. Odds of In-Hospital Mortality by Race over Hospital Volume
Independent variables are adjusted to median values for all patients (age = 70; sex = male; comorbidity = 1; state = NY; Year = 2003; Payer = Medicare), except where they are present in the x-axis. Surgeon and hospital volume, are set to the 90th percentile (>5 cases per year for surgeon and>12 cases per year for hospital) when not present in the x-axis.
Vertical bar represents specific scenario in Table 5. Shading indicates 95% confidence interval.

