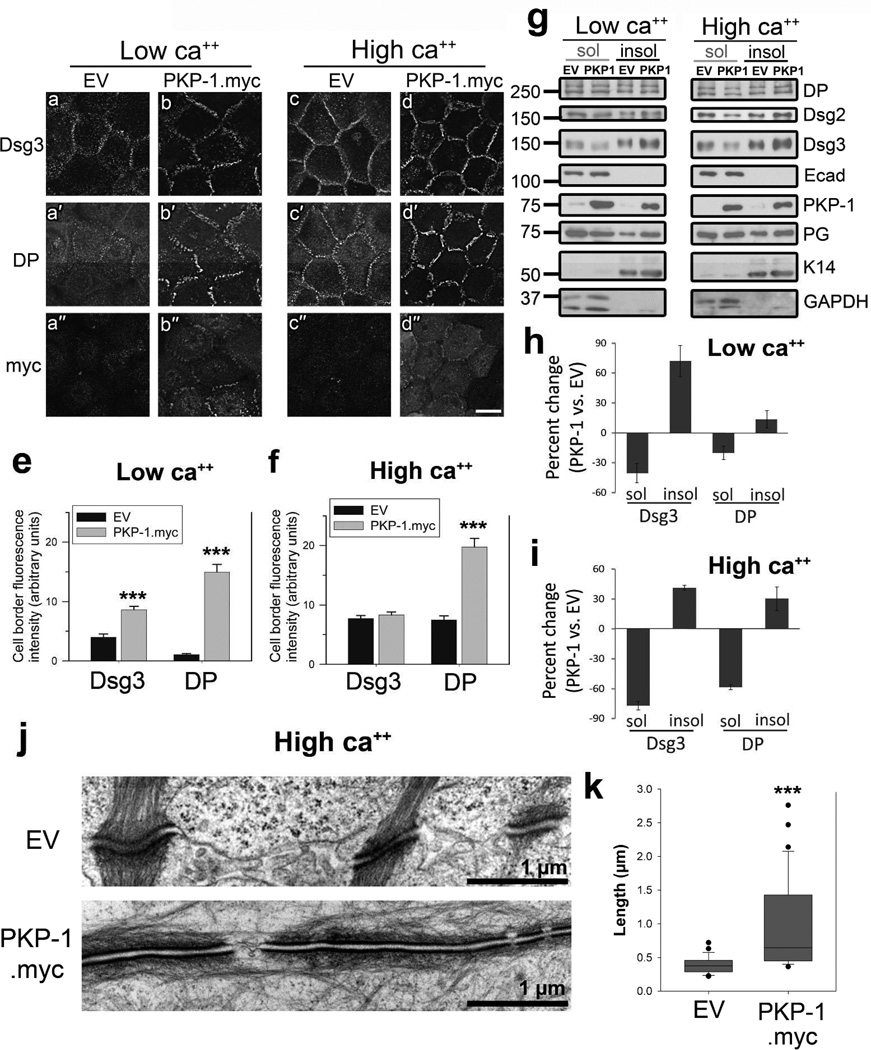
Figure 1. PKP-1 promotes desmosome formation.
(a–d) Immunofluorescence images and (e, f) quantification of cell-cell border fluorescence intensity from keratinocytes expressing empty vector (EV) or PKP-1.myc in low (0.1mM) or high calcium media (0.6mM) for 24 hours and immunostained for surface Dsg3, total desmoplakin (DP) and myc (PKP-1.myc). Scale bar: 20Hm. (e, f) Mean ± SEM (n= 50 borders per group); *** p < 0.001 compared with EV (Mann Whitney). (g,h,i) Sequential detergent extraction and western blot analysis of Triton X-100 soluble (sol) and insoluble (insol) proteins. Quantification represents the mean of three independent experiments. (j) Electron micrographs and (k) quantification of desmosome lengths (n= 25 desmosomes per group); *** p < 0.001 compared with EV (Mann Whitney). Scale bars 1Hm.

