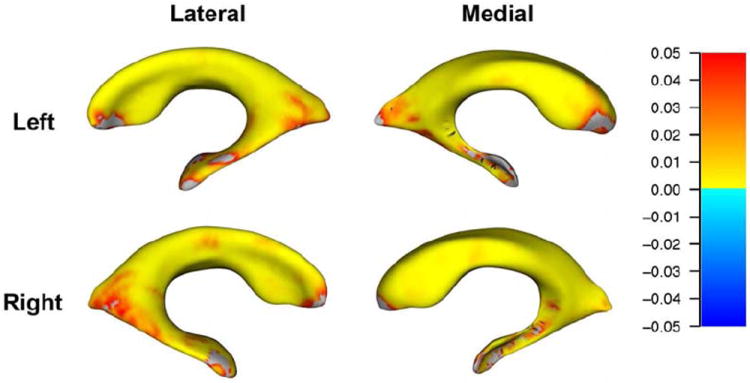
Figure 2. Surface maps depicting relationships between number of ApoE-ε4 alleles (0, 1, or 2) and regional deformations of the lateral ventricular surface at 24 month follow-up (N=479).

Red-to-yellow hues indicate regions where higher ApoE-ε4 loading is associated with expansion of the surfaces, after controlling for age, sex, and dementia status. For all statistical maps, the color bar encodes the FDR-corrected values (q<0.05) for the observed effects.
