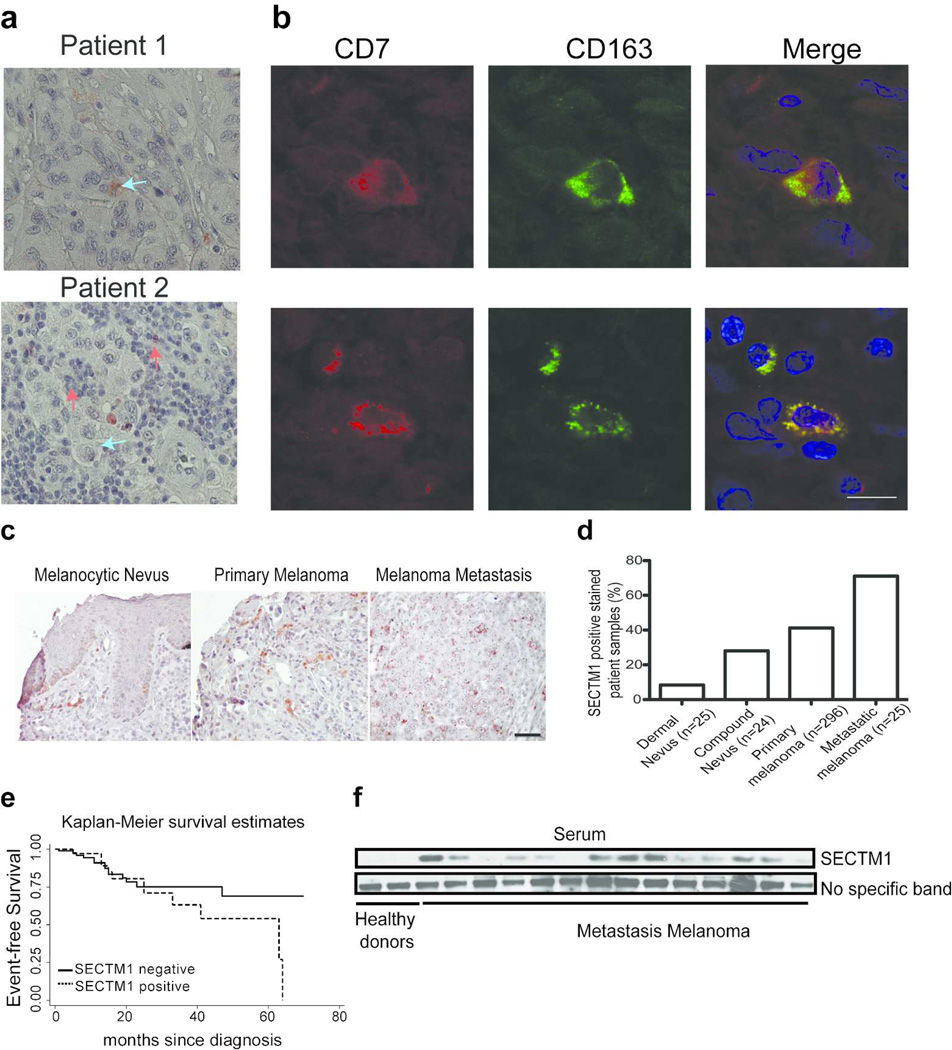
Figure 4. Expression of CD7 and SECTM1 melanoma tissues.
(a) Immunohistochemical analysis of CD7 expression in melanoma lesions. Arrow indicates CD7-positive macrophages. Red arrows: macrophage-positive cells. Blue arrows: lymphocyte-positive cells. Scale bar = 50 µm. (b) Confocal analysis of the co-expression of CD7 with CD163 in melanoma lesions. Red color: CD7-positive cells. Green color: CD163-positive cells. Blue color: DAPI was used to stain cell nuclei. Scale bar = 100 µm. (c) Representative images of expression of SECTM1 in melanocytic nevus, primary melanoma and melanoma metastasis lesion as noted. Immunohistochemical analysis was conducted to analyze SECTM1 expression in paraffin-embedded sections of the human tissue microarray. Scale bar = 50 µm. (d) Summary of the percent of SECTM1-positive samples in melanocytic nevus, primary melanoma and melanoma metastasis lesion. (e) Kaplan-Meier plot of event-free survival in melanomas with or without expression of SECTM1. Log rank test P-value = 0.14. (f) Serum samples from healthy donors and metastatic melanoma patients were used for detecting SECTM1 expression by western blot analysis. A non-specific band was used as a loading control.

