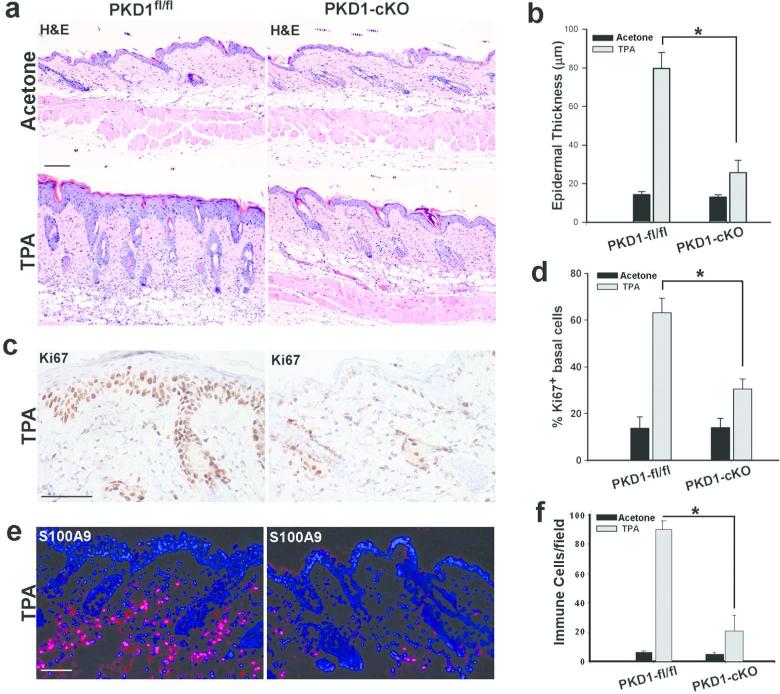
Figure 3. Suppression of TPA-induced responses in PKD1-cKO mouse skin.
PKD1fl/fl or PKD1-cKO dorsal skin treated with a single dose of acetone (carrier control) or TPA (5 nmole/100 ul aceton) and 48 hrs later skin biopsies were taken and processed for histological analysis. Skin sections were stained with (a) H&E for histology, (c) antibody against proliferation marker Ki67 (peroxidase, dark brown staining) or (e) antibody against leukocyte marker S100A9 followed by Alexa-594 conjugated secondary antibody (red). Dapi (nuclear blue staining) was used as a counterstain. A representative of 6 mice from two separate experiments is shown. Scale Bars=100 μm. Graphs show the average thickness of epidermis (b), the number of Ki67-positive basal keratinocytes (d) and, the number of inflammatory S100A9-positive cells (f) in skin sections. Six different regions in sections prepared from three different mice were quantified. Values represent mean +SEM (n=3); * P< 0.001 TPA-treated PKD1-cKO versus TPA-treated control.

