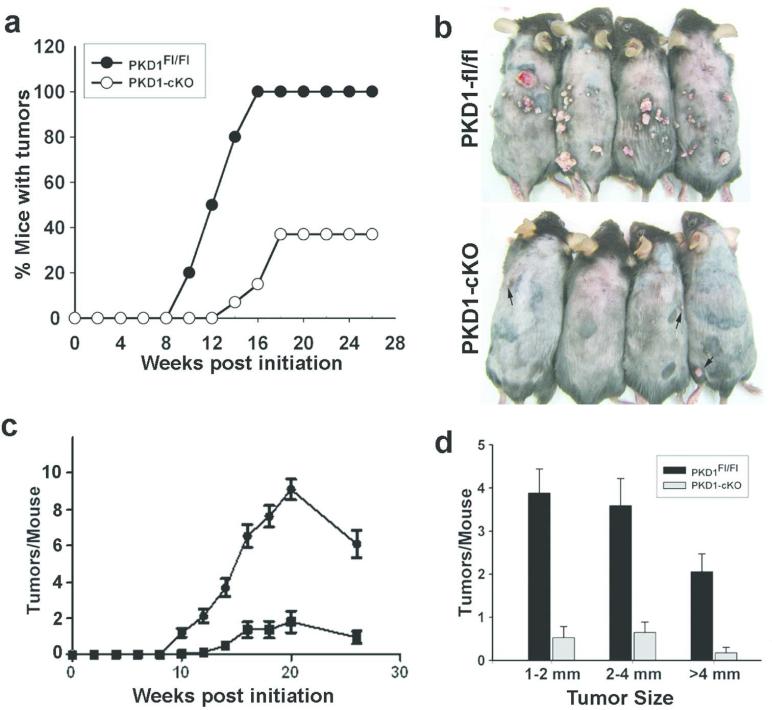
Figure 4. Reduced skin tumor formation in PKD1-deficient mice.
(a) The incidence of tumors in groups of PKD1-cKO and control mice (n=15/group) subjected to DMBA/TPA protocol and monitored weekly for tumors >1.5 mm in diameter. (b) Representative mice from each group showing reduced tumor number and volume in PKD1-cKO at 26 weeks. Arrows in the lower panel indicate small tumors developed in PKD1-deficient mice. (c) Kinetics of tumor multiplicity using 15 mice per genotype. P<0.0001 for overall differences and P<0.001 for differences between PKD1-cKO mice versus PKD1fl/fl at each week. (d) Graph showing average size of tumors developed per mouse. Error bars represent standard error of the mean. P<0.001 PKD1-cKO mice versus PKD1fl/fl.

