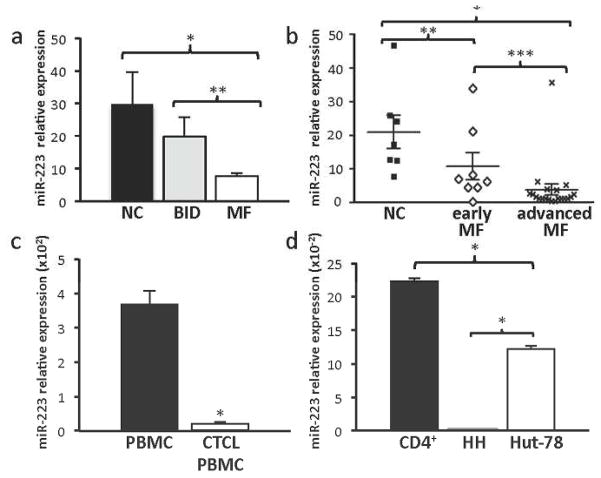
Figure 1. Reduced expression of miR-223 in MF.
miR-223 expression levels relative to control small RNA RNU24 levels by qRT-PCR. a) Skin biopsies from subjects with MF (n=8, early stage IA-IIA; n=20, advanced stage IIB-IV), normal controls (NC, n=7) (*p<0.001), and BID (n=6) (**p=0.04). b) Skin biopsies from normal controls and patients with early or late stage MF, (*p<0.001, **p=0.022, ***p=0.036. c) Pooled control Red Cross PBMC and CTCL PBMC (n=6, *p<0.001). d) CTCL cell lines (HH and Hut-78) and CD4+ normal controls (n=2, *p<0.001).

