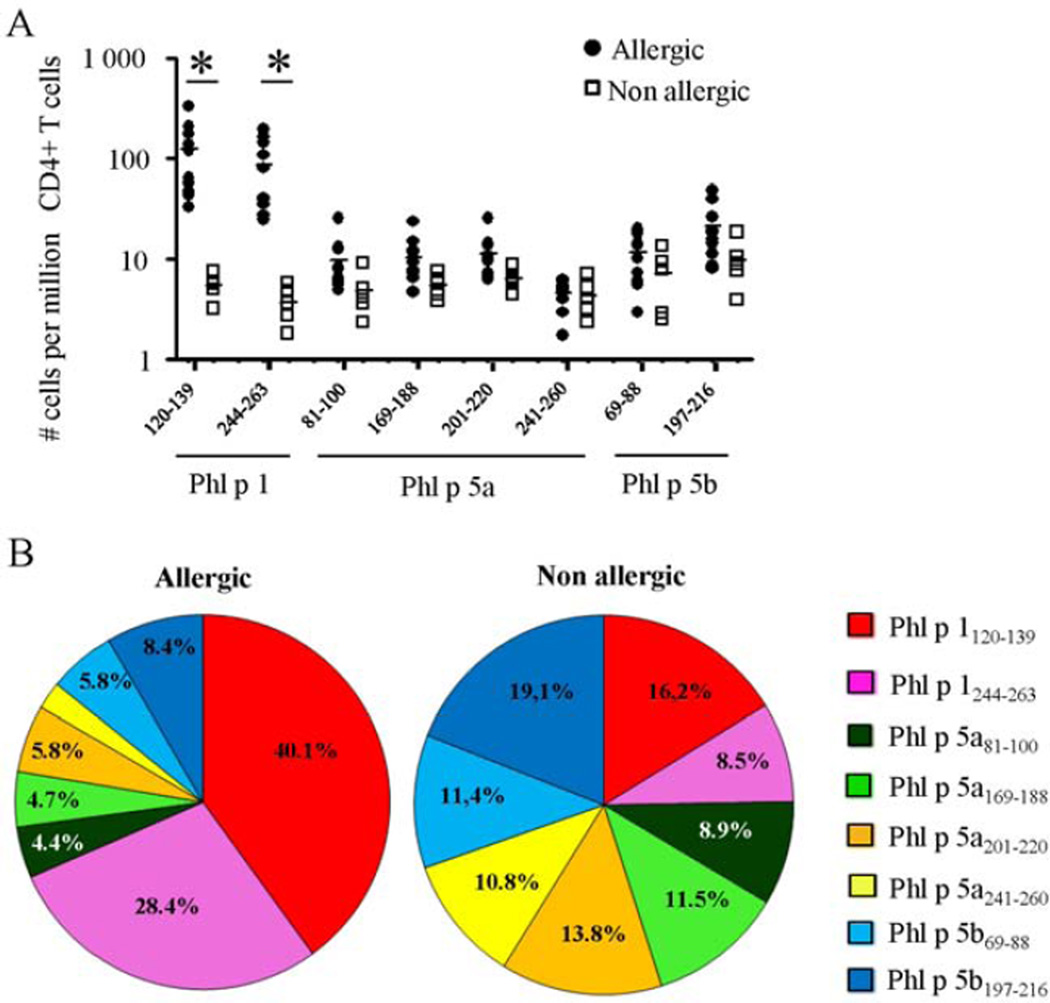
Figure 1.
A, Ex vivo frequencies of group 1 and group 5 TGP-specific T cells in allergic individuals (filled circles) and non-atopic subject (open squares). *P < 0.001. B, Contribution of each epitope to the global DR04:01-TGP allergen-specific T cell response in allergic individuals (n=10) and non-atopic subjects (n=5). Data are presented as the mean values from each group in pie charts.

