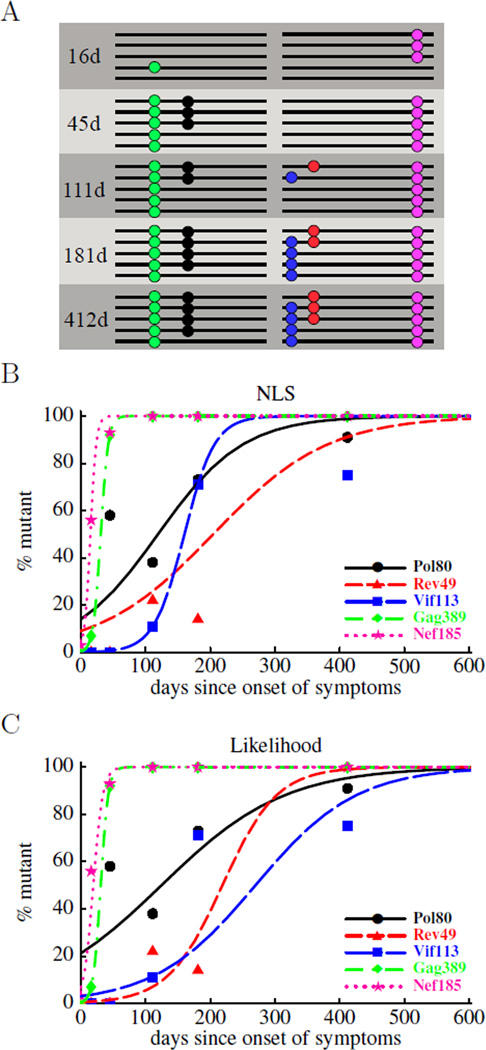
Figure 2.
Schematic representation of experimental data on HIV escape from CTL responses (panel A) and fits of the mathematical model to such data (panels B and C). In panel A, a small number of sequences covering either the 3’ or 5’ half of the HIV genome has been obtained at 5 different time points. Escape mutations are indicated as colored dots. Typical sequence sample sizes range between 10 and 20. In panels B and C we show the fits of the mathematical model (eqn. (10)) to experimental data using nonlinear least squares (panel B) or likelihood (panel C) methods. We estimate two parameters: the rate of escape, ε, and the initial frequency of the escape variant in the population, f0. The estimated escape rate obtained by both methods is shown in Table 2.

