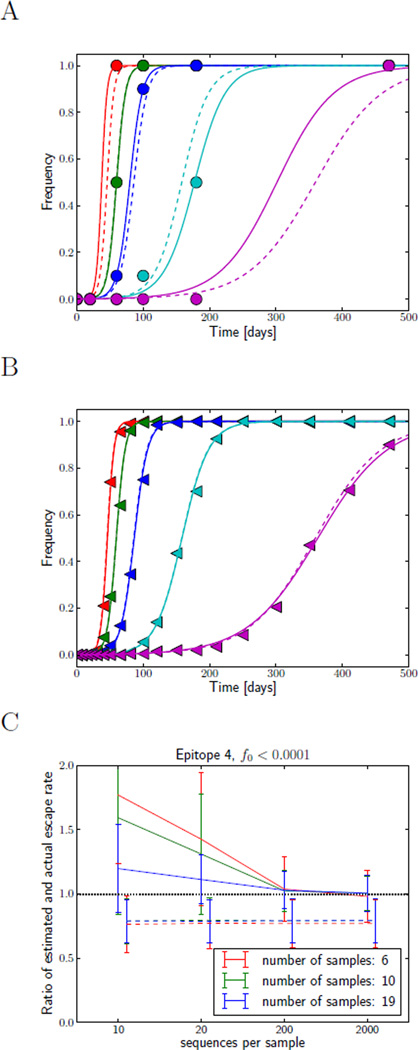
Figure 4.
Influence of sampling frequency and sampling depth on fidelity of esimates of the escape rate. Panels A and B show mutation frequencies in population samples for infrequent shallow sampling (n = 10, A), and more frequent deep sampling (n = 200, B). The actual mutation frequencies are shown as dashed lines, the sample frequencies are indicated by symbols, while the fitted trajectories as solid lines. Obviously, more frequent and deeper sampling will improve the estimates of the escape rate. This is quantified in panel C. It shows the mean estimate of the escape rate of epitope 4 (left pointed triangles) and its standard deviation as a function of sampling depth for different sampling frequencies. The estimates are shown relative to the true value of the simulated escape rate, hence a systematic deviation from one represents a bias. The dashed lines show the results of fitting only the escape rate, ε, while fixing f0 = 10−4. Those fits show a systematic bias towards lower estimates, but have small variance and are insensitive to sample depth or frequency. The solid lines correspond to estimates where both ε and f0 were fitted, while constraining f0 to be smaller than 10−4. These fits show much larger variance and a strong bias at small sampling frequencies, but are unbiased at frequent and deep sampling.

