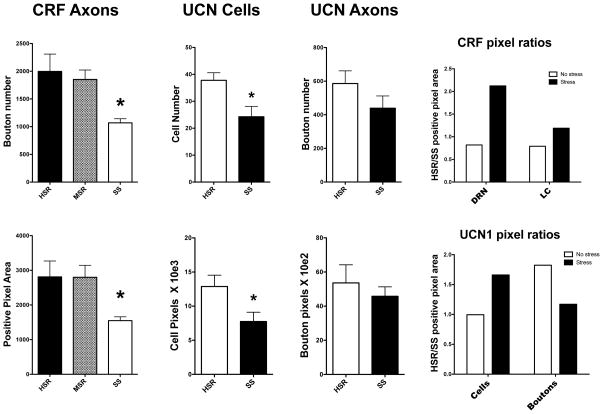
Figure 2.
Histograms illustrating CRF immunostaining analysis in the raphe, the UCN1 cell analysis, the UCN1 axonal bouton analysis, and the HSR/SS ratios of the CRF and UCN1 positive pixel areas. *Significantly different from HSR by Newman-Keuls posthoc pairwise comparison or by t-test.
Left. Comparison of CRF axons.
Top. There was a significant difference in the number of CRF positive boutons between the groups (ANOVA F [2,9]=5.66, p<0.025). The SS group was significantly lower than the HSR and MSR groups with posthoc analysis (Newman-Keuls, p<0.05).
Bottom. There was a significant difference in the CRF positive pixel area between the groups (ANOVA F [2,9]=4.6, p<0.042). The SS group was significantly lower than the HSR group with direct comparison (t [6]=2.67, p<0.037).
Middle. Comparison of UCN1 cells.
Top. Direct comparison between HSR and SS groups found that the SS group had significantly fewer cells than the HSR group (t [7] = 2.90, p<0.023).
Bottom. Direct comparison between HSR and SS groups found that the SS group had significantly lower positive pixel area than the HSR group (t [7] = 2.31, p<0.05).
Right. Comparison of UCN1 boutons.
Top. ANOVA did not find a significant difference in UCN1 bouton number between the groups and t-test found no difference in a direct comparison of HSR and SS groups.
Bottom. ANOVA did not find a significant difference in UCN1 bouton pixel area between the groups and t-test found no difference in a direct comparison of HSR and SS groups.
Far Right. CRF and UCN1 Ratios.
Top. The HSR/SS ratio for CRF boutons was less than 1.0 in the absence of stress [extracted from 28] and was greater than 1.0 with stress, in both the dorsal raphe nucleus (DRN) and the locus ceruleus [extracted from 29]. This indicates that the HSR group was lower than the SS group with no stress, but the HSR group was higher than the SS group with stress.
Bottom. The HSR/SS ratio for UCN1 cell positive pixel area equaled 1.0 without stress and was greater than 1.0 with stress. This indicates that UNC1 cell pixel area was similar without stress, but the HSR group was markedly higher than the SS group with stress. In contrast, the HSR/SS ratio for UCN1 bouton positive pixel area was greater than 1.0 without stress, but equal to 1.0 with stress. This indicates that there was a decrease in UCN1 transport with moderate short-term stress. Primary data for UCN1 cell and bouton pixel area was extracted from Weissheimer et al (28).

