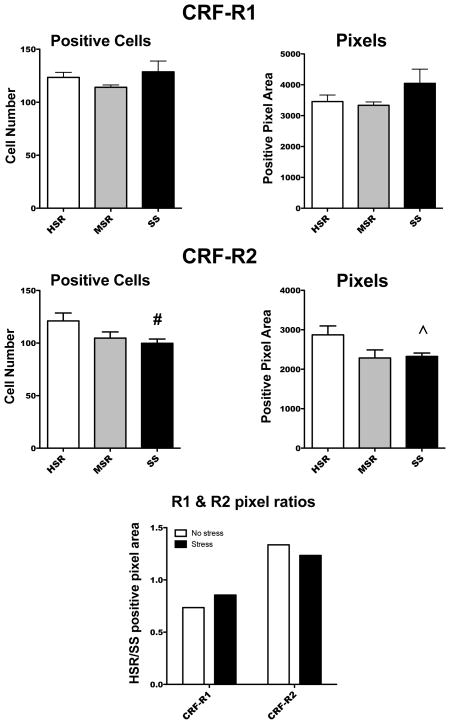
Figure 4.
Histograms illustrating the analysis of CRF-R1 (top) and CRF-R2 (middle) positive cells and positive pixel area. The HSR/SS ratio for CRF-R1 and CRF-R2 in the presence and absence of stress is also shown (bottom). # Significantly different from HSR with t-test; ^ Difference from HSR not quite statistically significant.
Top. There was no difference in either the number of CRF-R1 positive cells or in the CRF-R1 positive pixel area.
Middle. There was a trend toward lower numbers of CRF-R2 positive cells as stress sensitivity increased (ANOVA F [2,10]=3.30, p<0.08). In a direct comparison of the HSR and SS groups, the SS group was significantly lower than the HSR group (t [7] = 2.31, p<0.05). There was a trend toward lower CRF-R2 positive pixel area in the SS group when directly compared to the HSR group (Welsh’s t [5]= 2.25, p< 0.07).
Bottom. The ratio of HSR/SS was similar for each receptor subtype with or without stress. The CRF-R1 ratio was less than 1.0, with or without stress, suggesting that the HSR group was lower than the SS group under each condition. However, this difference did not reach statistical significance in comparison of the primary data. The CRF-R2 ratio was greater than 1.0, with or without stress, signifying the HSR group was higher than the SS group under each condition. Primary data in the absence of stress was extracted from (35).

