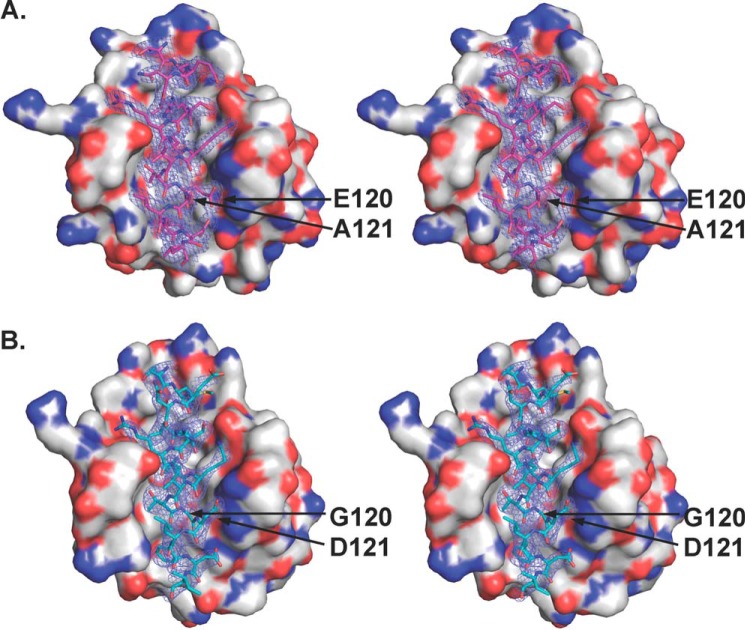
FIGURE 4.
Stereo view of complexes of M11 bound to DS peptide (A) and WT BH3 domain (B) (Protein Data Bank code 3DVU). Atoms are colored by type as in Fig. 2, with M11 shown as molecular surface, whereas the DS peptide (magenta carbons) and WT BH3D (teal carbons) are displayed in atomic detail. The blue mesh represents the electron density contoured at 1 σ above the mean for a 1.6 Å radius around the peptide atoms from the 2Fo − Fc map at 2.1 Å for the DS peptide and at 2.5 Å for the WT BH3 domain complexes. Labels indicate residues substituted in the DS peptide.

