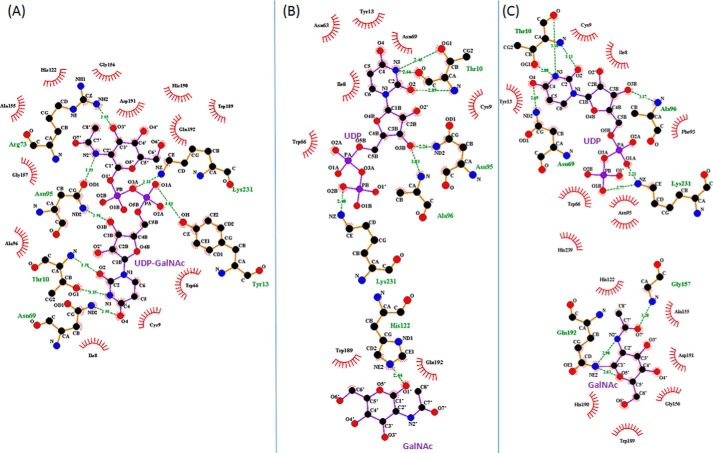
FIGURE 7.
Ligplot of BoGT6a E192Q-ligand interactions with key residues in different complexes (32). A, structure A, B, structure B. C, structure C. Ligands are shown in purple, interacting residues are shown in orange, and hydrophobic interacting residues are shown in red. Hydrogen bonds are shown as green dashes.

