FIGURE 2.
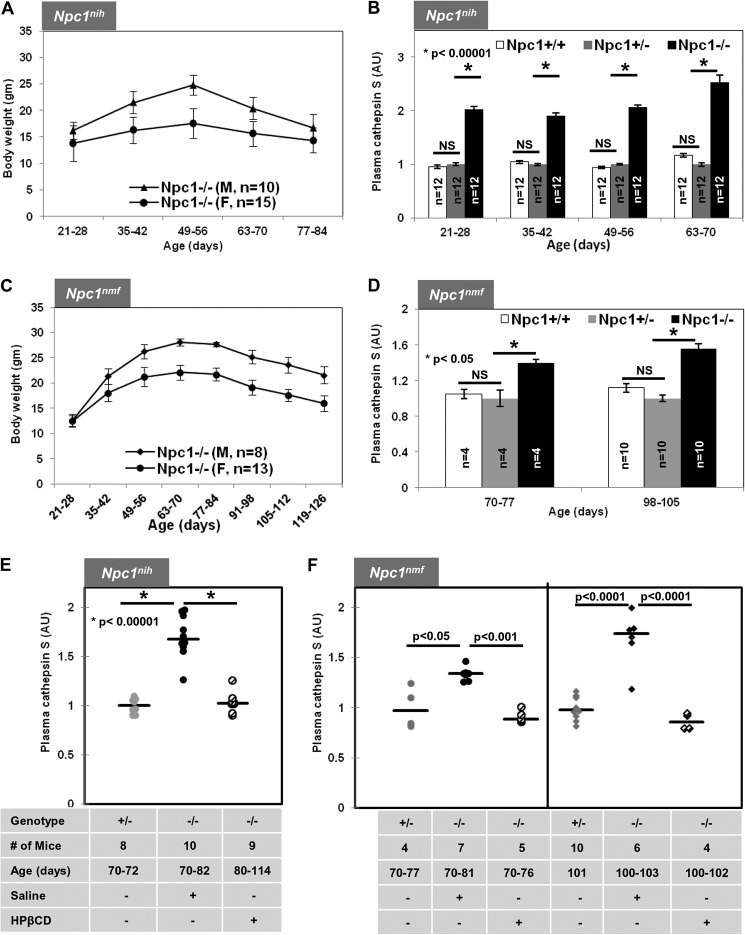
Plasma cathepsin S levels are elevated in Npc1nih and Npc1nmf164 mice and reduced after cyclodextrin treatment. A, weight as a function of age for Npc1nih male and female mice. Homozygous mutant Npc1nih (Npc1−/−) mice begin weight loss at 49–56 days followed by further decreases and death at 77–84 days. B, elevated cathepsin S detected in plasma of Npc1nih Npc1−/− mice as determined by ELISA (“Experimental Procedures”). C, weight as a function of age of Npc1nmf male and female mice. Homozygous mutant Npc1nmf (Npc1−/−) mice lose weight from 84–91 days onward followed by further decreases and death at 119–126 days. D, elevated cathepsin S level in plasma of Npc1nmf Npc1−/− mice. E, cathepsin S levels in Npc1nih Npc1−/− (−/−) mice treated with saline or HPβCD compared with Npc1+/− (+/−). F, cathepsin S levels in Npc1nmf Npc1−/− (−/−) mice treated with saline or HPβCD compared with Npc1+/− (+/−). In B, D, E, and F, blood plasma was sampled at the indicated time points. -Fold change in cathepsin S is expressed relative to average levels of activity in Npc1+/− mouse plasma. The data represent mean triplicate values ±S.D. (error bars). Median values are shown by horizontal lines. Statistical significance was determined using Student's t test. *, p < 0.0001 in B, p < 0.05 in D, and p < 0.00001 in E. NS indicates not significant. gm, grams; AU, arbitrary units.

