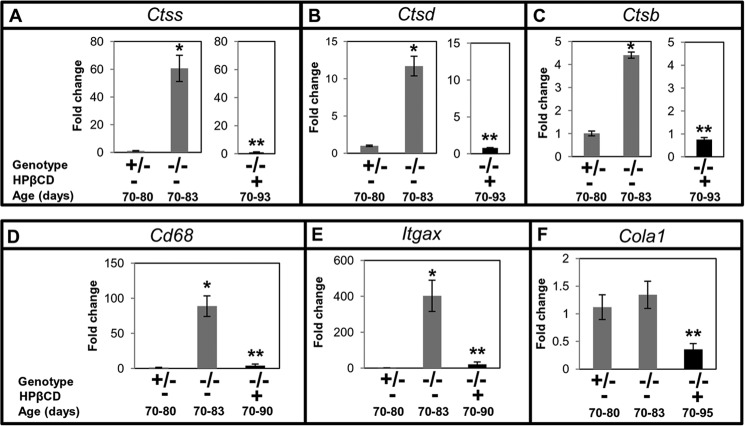
FIGURE 3.
Effect of cyclodextrin treatment on the expression of cathepsins and additional markers of inflammation and fibrosis in mouse liver. Ncp1nih Npc1−/− mice (−/−) were given weekly HPβCD injections. Npc1+/− (+/−) animals remained untreated. Animals were sacrificed at the indicated ages, organs were removed and processed, and total RNA was extracted. qPCR was undertaken to determine the expression level of Ctss (A), Ctsd (B), Ctsb (C), Cd68 (D), Itgax (E), and Cola1 (F). Each group consisted of four mice except for the Cola1 assay. Cola1 included six Npc1+/−, six untreated Npc1−/−, and seven HPβCD-treated Npc1−/− mice. -Fold changes shown indicate transcript levels in Npc1−/− relative to Npc1+/− mice. Gapdh was used as an internal control. The data represent the mean ± S.D. (error bars). The data shown for untreated Npc1−/− mice in A–C are identical to those shown in Fig. 1B to enable comparisons across the study. *, Npc1+/− versus untreated Npc1−/−, p < 0.005; **, untreated Npc1−/− versus treated Npc1−/−, p < 0.005.

