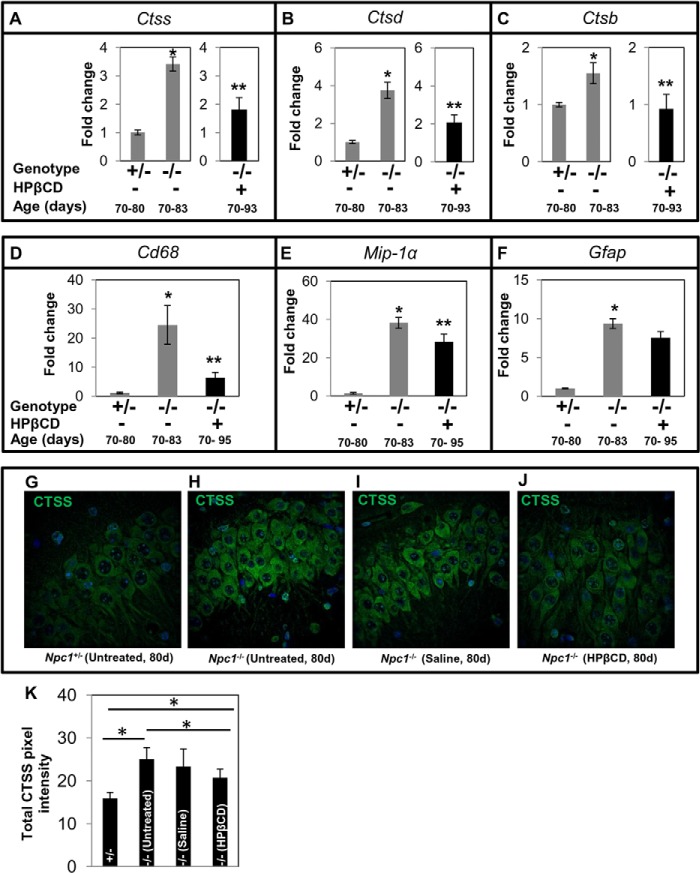
FIGURE 5.
Effect of cyclodextrin treatment on the expression of cathepsins and inflammatory markers in Npc1nih mouse brain. Total RNA from the brain was prepared, and qPCR analysis was carried out for Ctss (A), Ctsd (B), Ctsb (C), Cd68 (D), Mip-1α (E), and Gfap (F). For Ctss, Ctsd, and Ctsb (A–C), there were four mice per group. For Cd68, Mip-1α, and Gfap (E–F), there were six mice per group. -Fold change in Npc1−/− is expressed relative to transcript levels in Npc1+/− mice. The data represent mean triplicate values ±S.D. (error bars). Gapdh was used as an internal control. The data shown for untreated Npc1−/− mice in A–C are identical to those shown in Fig. 1C to enable comparisons across the study. *, Npc1+/− versus untreated Npc1−/−, p < 0.005; **, untreated Npc1−/− versus treated Npc1−/−, p < 0.05. G–J, immunofluorescence micrographs showing the expression of CTSS in the hippocampal neurons of untreated Npc1+/− mice (G), untreated Npc1−/− mice (H), Npc1−/− mice treated with saline (I), and Npc1−/− mice treated with HPβCD (J). Enhanced CTSS staining was seen in untreated and saline-treated Npc1−/− mice. Original magnifications, ×40. Representative images are shown. K, quantification of CTSS fluorescence using NIH ImageJ software. Eight sections (two mice/group, four sections/mouse) were analyzed. The data represent the mean ± S.D. (error bars). *, p < 0.05. d, days.

