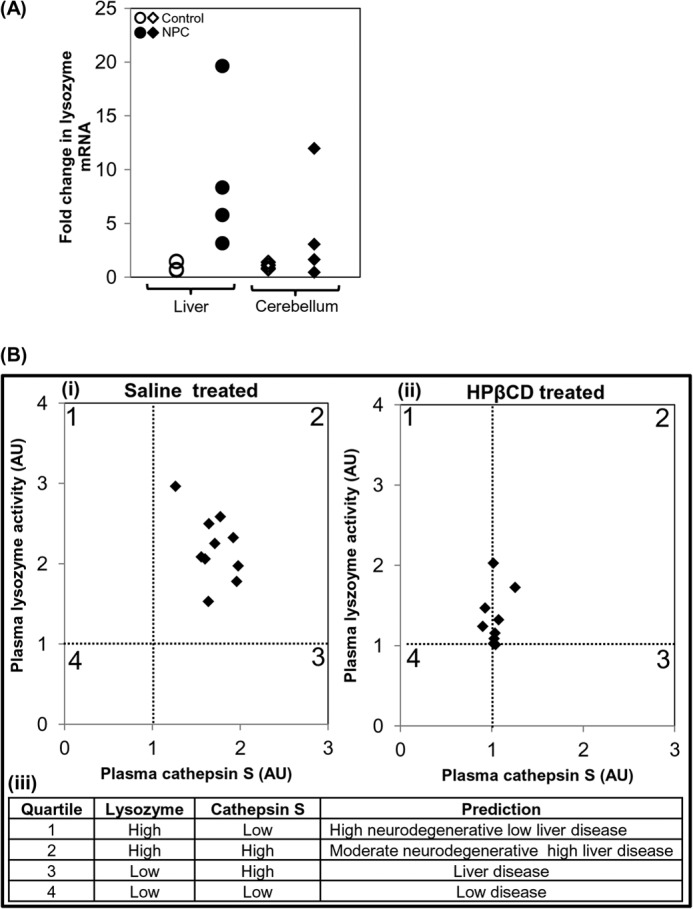
FIGURE 9.

Evidence of lysozyme elevation in patients and development of a composite scale to distinguish among four distinct states of cerebral and liver disease. A, expression analysis of LYZ in livers and cerebella of four human NPC patients. Expression levels of LYZ were determined by qPCR. -Fold change is relative to the average value of control subjects. GAPDH was used as an internal control. B, correlation between plasma lysozyme activity and cathepsin S level in NPC mice treated with saline (panel i), HPβCD (panel ii), and a derived quartile score predictive of four distinct states of neurodegeneration and liver disease (panel iii), suggesting composite plasma diagnostic of neuroinflammation. AU, arbitrary units.
