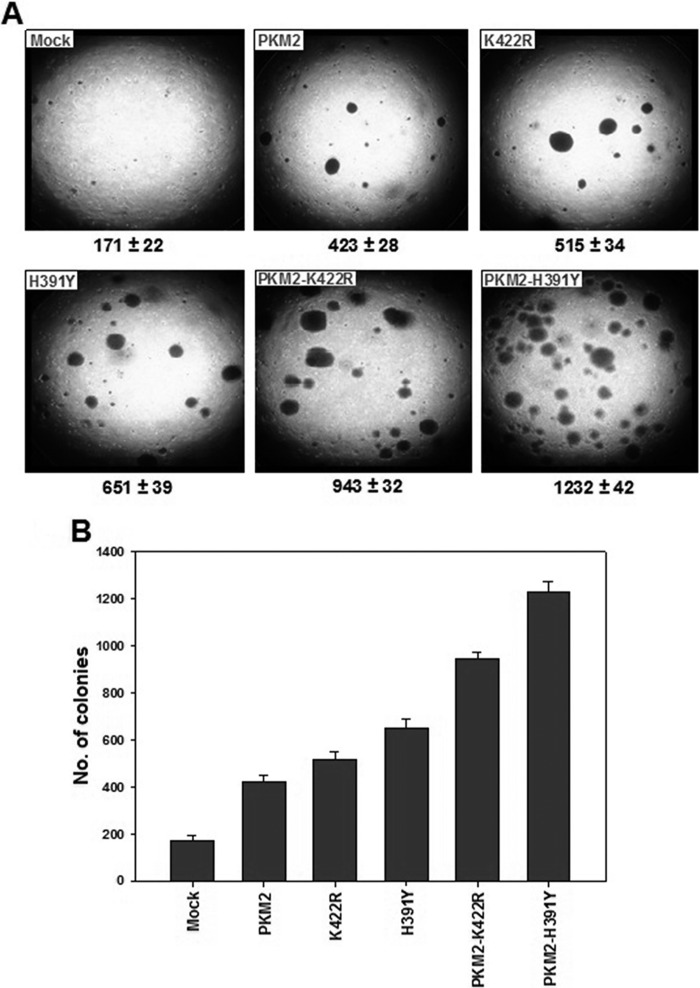
FIGURE 5.
Soft agar assay. A, microscopic field images at 10× representing the actual density of colonies obtained after 12 days of seeding independent and co-transfected H1299 cells. Colony numbers in the entire well are given below. B, bar graph depicting the differences between the number of colonies obtained in each case.

