FIGURE 1.
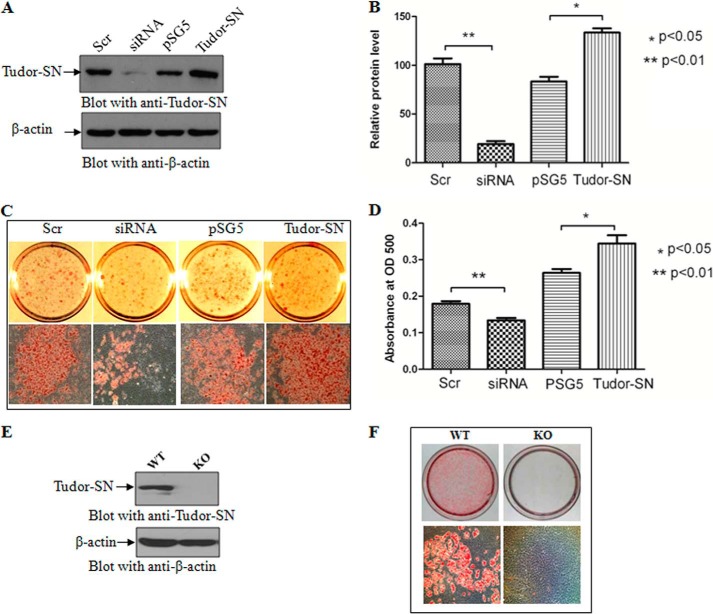
The effect of Tudor-SN on the differentiation of 3T3-L1 and MEF cells. A, 3T3-L1 cells were transfected with pSG5-Tudor-SN plasmid, pSG5 vector, Tudor-SN siRNA, or scramble (Scr) siRNA, and the transfection efficiency was detected by Western blot. B, statistical analysis of the transfection efficiency. The graph represents densitometric units normalized to β-actin for each protein and is representative of the S.D. Statistical analysis was performed using the independent-samples Student's t test; *, p < 0.05(n = 3); **, p < 0.01(n = 3). C, after transfection with siRNA or plasmids, 3T3-L1 cells were treated with DMI for 8 days. The cells were stained with Oil Red O to observe lipid droplet formation. D, statistical analysis of lipid droplet formation. Oil Red O was washed away with 60% isopropyl alcohol and measured at an optical density (OD) of 500. Statistical analysis was performed using the independent-samples Student's t test; *, p < 0.05(n = 3); **, p < 0.01(n = 3). E, expression levels of Tudor-SN in MEF-WT and MEF-KO cells. F, knock out of Tudor-SN severely affects adipogenesis. MEF-WT and MEF-KO cells were treated with DMI for 8 days. The cells were stained with Oil Red O to observe lipid droplet formation.

