FIGURE 2.
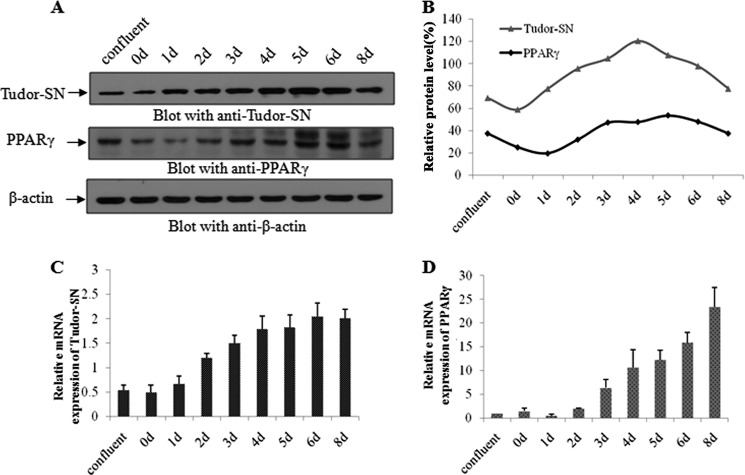
The expression of Tudor-SN and PPARγ are both enhanced in 3T3-L1 cells during adipogenesis. A, TCLs were harvested at different time points during the differentiation process as indicated and incubated with anti-Tudor-SN antibody, anti-PPARγ antibody, and anti-β-actin-antibody as a control. B, the band intensity was quantified using densitometry and normalized to the band intensity of β-actin. Shown are mRNA levels of Tudor-SN (C) and PPARγ (D) during adipogenesis. The expression levels were normalized to GAPDH levels.

