
FIGURE 5.
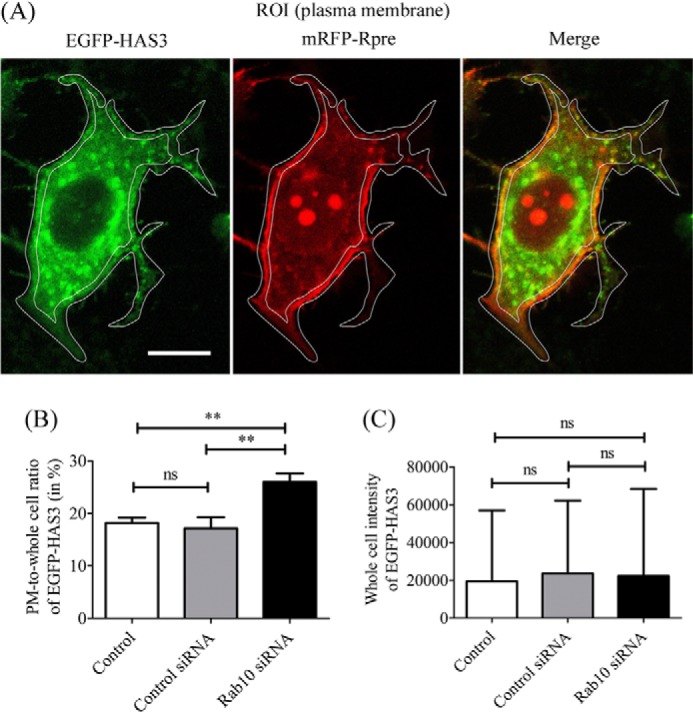
Plasma membrane residence of HAS3 is increased by Rab10 silencing. A, a ROI (white line) was set around the plasma membrane marked with mRFP-Rpre. Scale bar, 10 μm. B, the plasma membrane/whole cell ratio of EGFP-HAS3 indicated that Rab10 silencing increased the plasma membrane residence of EGFP-HAS3. C, the whole cell signal of EGFP-HAS3 was not altered by the treatments. Data represent means ± S.E. (error bars) of three independent experiments, each containing 14–15 images/group. **, p < 0.001; ns, not significant (one-way ANOVA, Tukey's test).