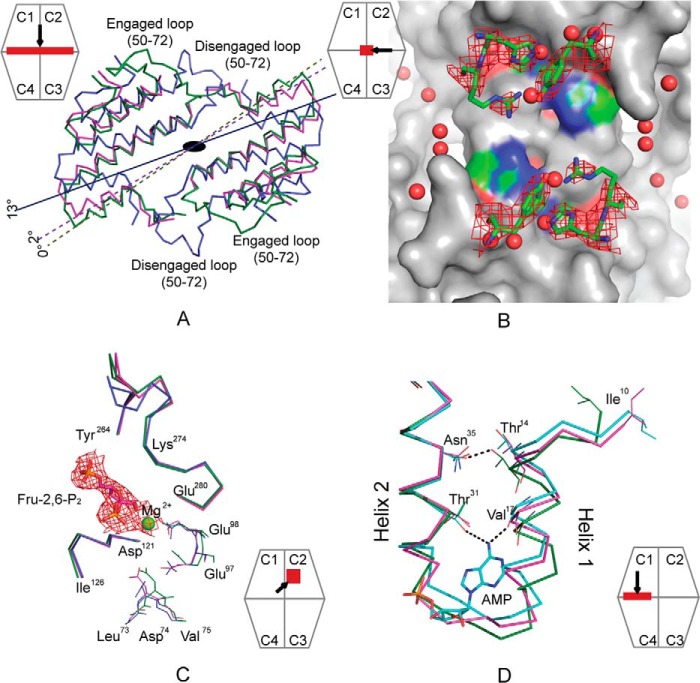
FIGURE 3.
Conformational changes of Cav−pFBPase induced by Fru-2,6-P2. A, subunit pair rotations induced by Fru-2,6-P2 in wild-type (blue, 13°, PDB code 2QVV) and Cav− pFBPase (magenta, 2°) relative to R-state pFBPase (green, PDB code 1CNQ). C1–C2 subunit pairs are aligned, and residues 10–100 in C3–C4 subunit pairs are drawn as Cα traces. B, central cavity in Fru-2,6-P2 complexes of Cav− pFBPase, showing electron density (contour level, 1σ) for mutated residues His45, Arg46, and Tyr186. The image was generated with PyMOL (57). C, conformational differences at the active site for the Fru-2,6-P2 complex of Cav− pPBPase (magenta), the product complex of wild-type pFBPase (green; PDB code 1CNQ), and the Fru-2,6-P2 complex of wild-type pFBPase (blue). Individual subunits are aligned to eliminate differences due to subunit pair rotations. Electron density (contour level, 1σ) is provided for Fru-2,6-P2 and Mg2+. D, conformational differences at the AMP site for the Fru-2,6-P2 complex of Cav− pFBPase (magenta), the AMP complex of Leu54 pFBPase (cyan; PDB code 1YYZ), and the R-state product complex of wild-type pFBPase (green; PDB code 1CNQ). Dotted lines indicate hydrogen bonds. The relative positions of helices H1 and H2 are similar in the Fru-2,6-P2 complex of Cav− pFBPase and AMP complex of Leu54 pFBPase, which have subunit pair rotations of 2 and 3°, respectively, relative to the R-state product complex of wild-type pFBPase. Icons represent the region viewed and viewing direction.

