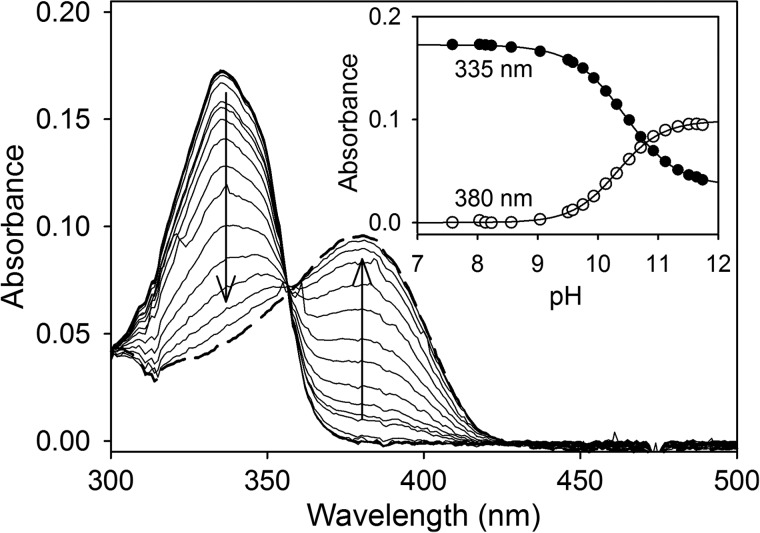
FIGURE 1.
QND pH titration. Main panel, QND (20 μm) spectral changes during stepwise addition of NaOH in 1 mm potassium phosphate buffer at 25 °C. Spectra at pH 7.6 (thick line) and pH 11.5 (dashed line). The inset show the data fitting at 335 and 380 nm to Equations 1 and 2, respectively.

