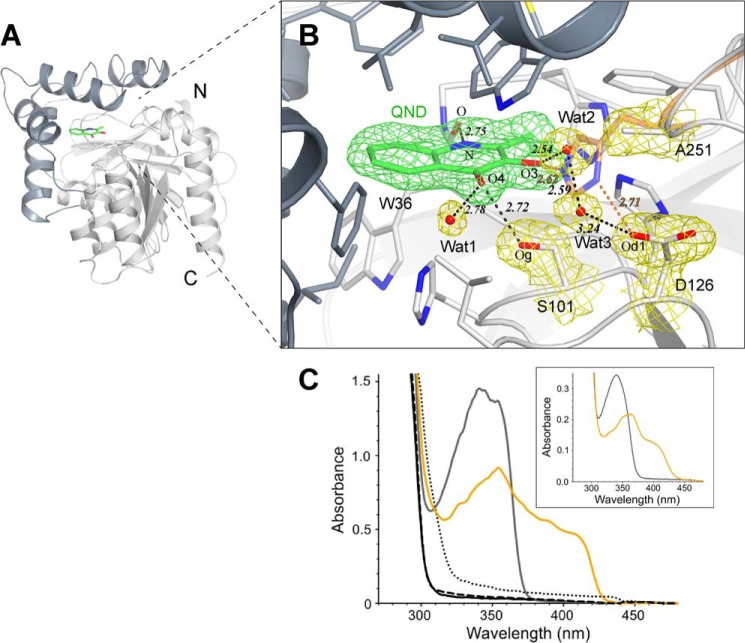
FIGURE 5.
HOD H251A·QND complex. A, schematic representation of HOD showing the α/β-hydrolase fold core and cap domains (light and dark gray, respectively). QND substrate bound at active site cavity (green). B, HOD H251A·QND active site. Residue side chains (gray sticks), water molecules (red spheres), and hydrogen bonds (black dashed lines), together with the 2mFo − DFc electron density maps (1.0σ level) for QND molecule (green) and for water molecules, Ser-101, Asp-126, and Ala-251 residues (yellow), are shown. For the WT HOD·QND complex, His-251 side chain (orange sticks) and distances (in Å, as orange dashed lines) are shown. C, in crystallo UV-visible spectra of WT HOD (black), H251A (dashed), HOD·N-acetyl-anthranilate product complex (dotted), HOD H251A·QND complex (gray line), and anaerobic WT HOD·QND complex (orange line) at pH 7 and 100 K. The inset shows the spectra in solution for anaerobic HOD H251A·QND (gray line) and WT HOD·QND (orange line) complexes at pH 8.

