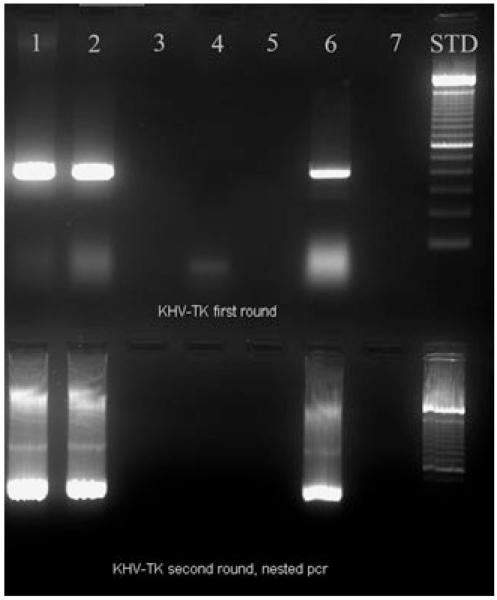
Figure 1.
PCR analysis of infected fish samples. Lane 1: DNA extract from the symptomatic fish that was later used for PAGE and subsequent ESI-MS analysis. Lane 2: DNA extract from the symptomatic fish that was later used directly for ESI-MS analysis. Lane 3: empty. Lane 4: DNA extract from the asymptomatic fish that was later used directly for ESI-MS analysis. Lane 5: empty. Lane 6: DNA extract from CyHV-3 positive control. Lane 7: empty. Fifteen microlitres of sample was added to lanes 1–7. Lane 8: 1 μL of Bio-Rad 1 kb DNA Ladder.

