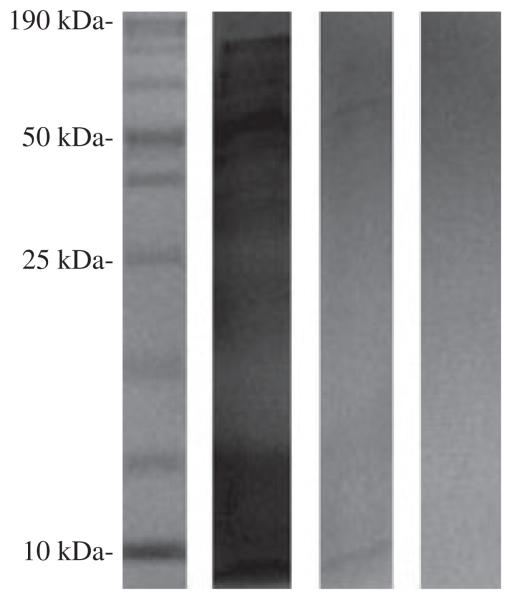
Figure 2.
PAGE analysis of immunoprecipitation. Lane 1: 5 μL of the ProSieve Unstained Protein Marker II (By Lonza), 10–200 kDa was used, which consists of 11 bands: 10, 15, 20, 30, 40, 50, 70, 100, 120, 150 and 200 kDa. The 120, 150 and 200 kDa did not separate well and appear as 1 band. Lane 2: Flow-through of non-denatured lysate (see methods). Lane 3: Monoclonal antibody–purified peptides. Two bands are observed: one at ~10 kDa and another band corresponding to ~60 kDa. Lane 4: First phosphate-buffered saline wash after elution with glycine (pH 3.0). Forty microlitres of the respective samples was run in lanes 2–4.

