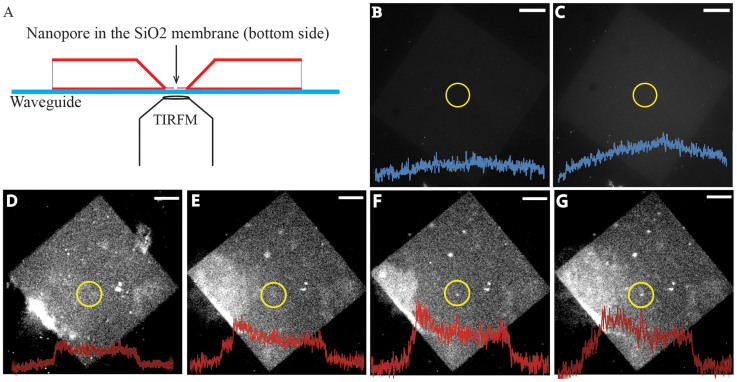
Figure 4. LY dye permeability through open hemichannels.
(A): Schematic of the experimental setup for TIRF imaging. A glass coverslip was placed over the chip and inverted for TIRF imaging. (B–C): Nanopore covered by lipid bilayer without connexons (control) at 5 and 10 min in 0 mm Ca2+. (D–G): Nanopore covered with Cx43 reconstituted lipid bilayer. In normal Ca2+ levels (1.8 mM) no increase in fluorescence over the nanopore region was observed up to 15 min (D). Under nominally Ca2+ free conditions, fluorescence intensity increased with time (E,F,G at 2,10 and 20 min, respectively) suggesting hemichannel opening leading to LY permeability through the pore. Fluorescence intensity profile plots as a function of pixel position along a line segment that spans the membrane and pass through the nanopore region are overlaid over the image to show apparent increase in fluorescence. Scale bar: 5 μm.

