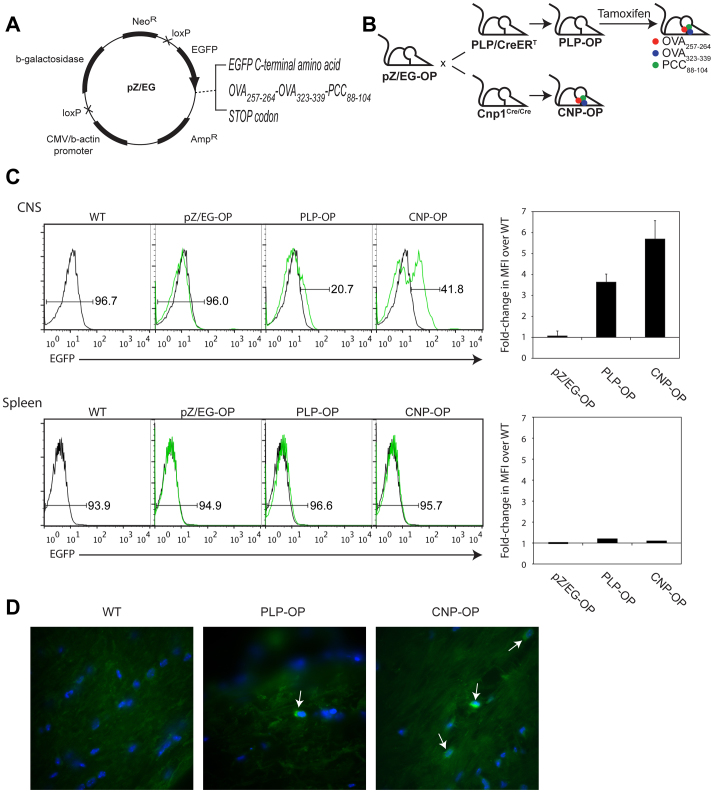
Figure 1. EGFP-fused neoepitopes are expressed in CNS of PLP-OP and CNP-OP mice.
(A) Map of pZ/EG plasmid. Neomycin resistance, NeoR; Ampicillin resistance, AmpR. Arrow, 5′ → 3′(drawn by JK). (B) Mouse breeding strategy (drawn by MGH). (C) Histograms show % EGFP+/− cells. WT (black line); transgenic (green line). Column graphs show average fold-change in mean fluorescent intensity (MFI) over WT. Error bars, SEM. (D) Spinal cord; 1000×. DAPI (blue); α-GFP-FITC (green). Arrows, EGFP+ oligodendrocytes.

