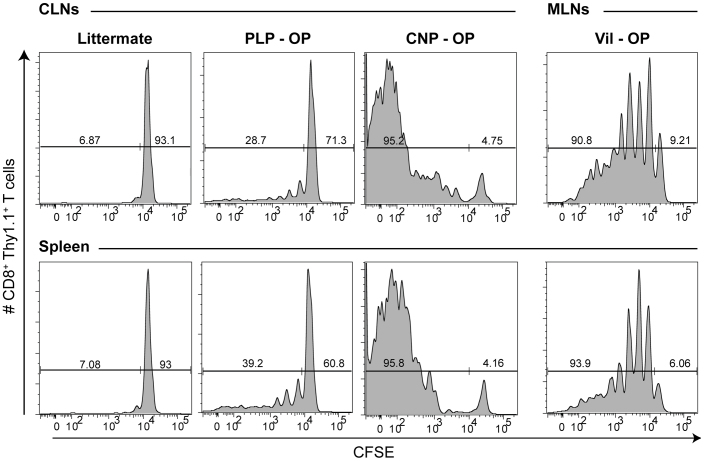
Figure 2. CNS neoepitopes are immunologically surveyed under normal conditions in the periphery.
Mice received 5 × 10⁵ neoepitope-specific T cells. FACS staining was performed on lymphocytes 6 days post-adoptive transfer. Histograms show CFSE dilution of CD8+ Thy1.1+ cells from CLNs (WT, PLP-OP, and CNP-OP mice) and MLNs (Vil-OP mouse) and spleen. Numbers indicate frequency of CFSEhigh vs. CFSElow/int cells. N = 8 littermates, n = 7 PLP-OP, n = 7 CNP-OP, and n = 4 Vil-OP mice (2 independent experiments).

