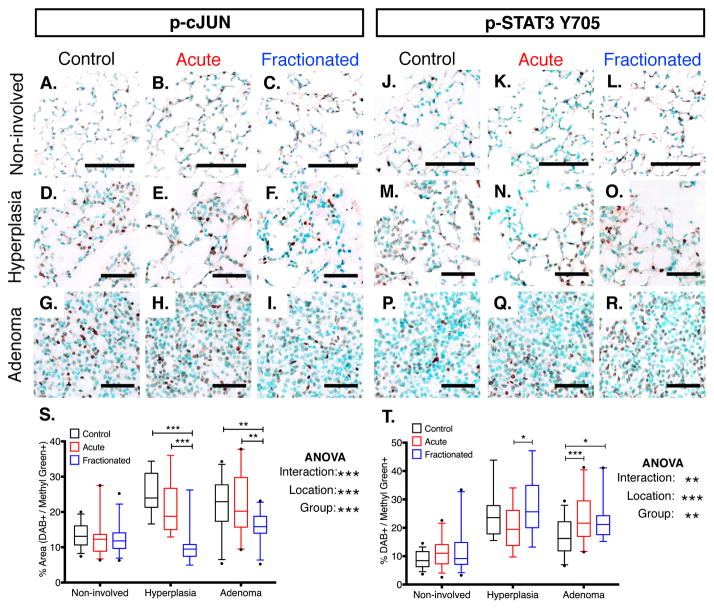
Figure 5. Inflammation-related Signaling Networks Differentially Activated in Cells Associated with Pre-initiated Lesions.
(A – R) Representative images of cJUN (A – I) and STAT3 Y705 (J – R) phosphorylation within hyperplasias, adenomas, or non-involved K-rasLA1 lung seventy days post-irradiation with an acute or fractionated dose of 1.0 Gy 56Fe- particles and age-matched unirradiated controls.
(S – T) Quantification of p-cJUN and p-STAT3 Y705 IHC analysis represented in (A – I) and (J – R), respectively (5 – 7 animals per group region; Non-involved: N = 5 fields per animal; hyperplasias: N = 11 – 13 per protein analyzed; adenomas: N = 19 – 26; Black outlines = Control; Red outlines = Acute; Blue outlines = Fractionated).
For non-involved regions, scale bars denote 100 μm; For initiated lesions, scale bars denote 50 μm; Graphs indicate median and quartiles (95% CI); IHC differences determined by two-way ANOVA with Tukey correction; *p < 0.05; **p < 0.01; **p < 0.001.

