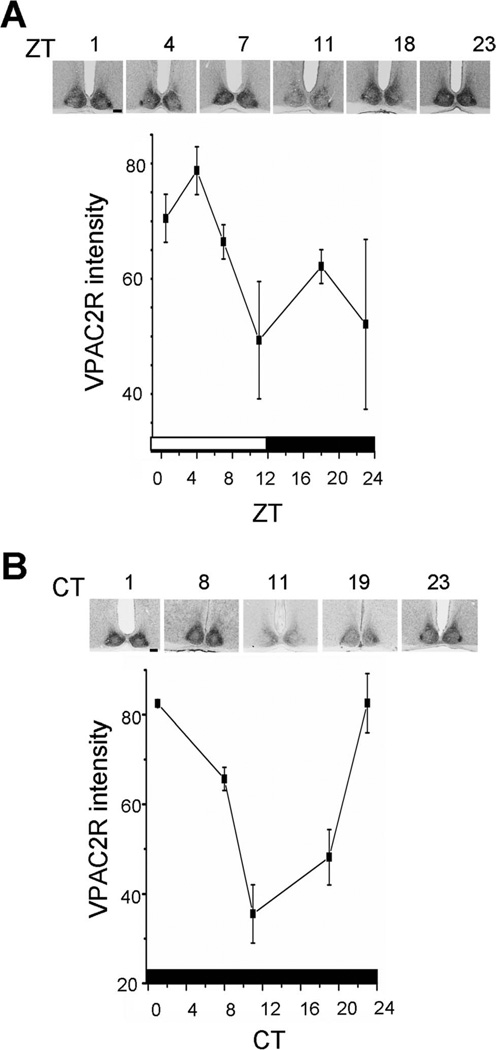
Figure 5.
VPAC2R expression oscillated in a light–dark cycle and in constant darkness. Data points represent the mean ± SEM of three brains at each time point. A: In LD, VPAC2R expression was rhythmic, with a peak after dawn (ZT1) and trough around dusk (ZT11). B: In DD, the pattern was similar, with peak VPAC2R expression around subjective dawn (CT1) and trough near subjective dusk (CT11). Insets show sections of the SCN from representative mice at each time point. The bars at the bottom of each plot show the times of lights on (white) and off (black) experienced by the mice. Scale bar = 100 µm in A,B.

