
FIG. 3.
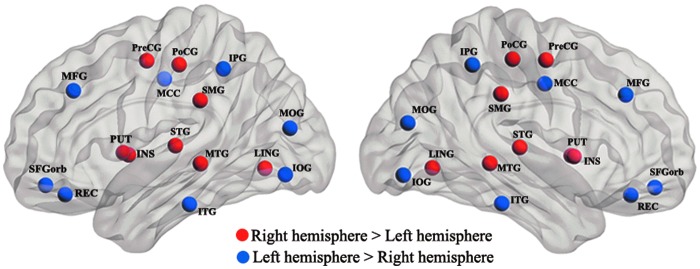
Hemisphere effect on nodal efficiency, as revealed by two-way repeated analysis of variances (ANOVAs). The red color nodes represent the rightward asymmetries, and blue color nodes indicate the leftward asymmetries. Statistical significance was reached when p<0.001 using a Bonferroni correction. Color images available online at www.liebertpub.com/brain