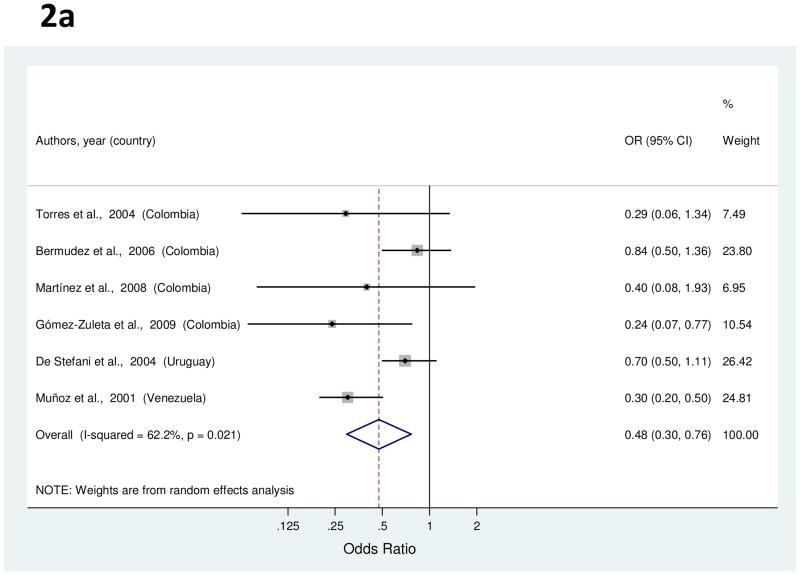
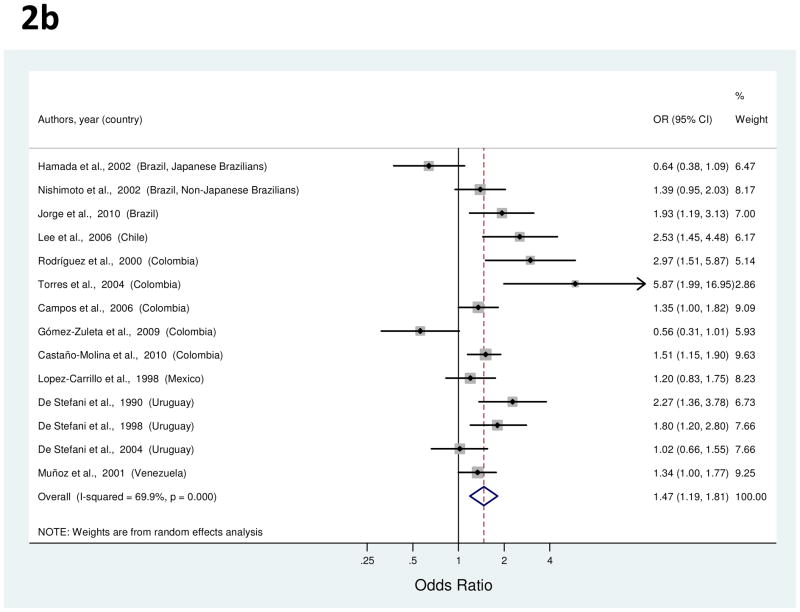
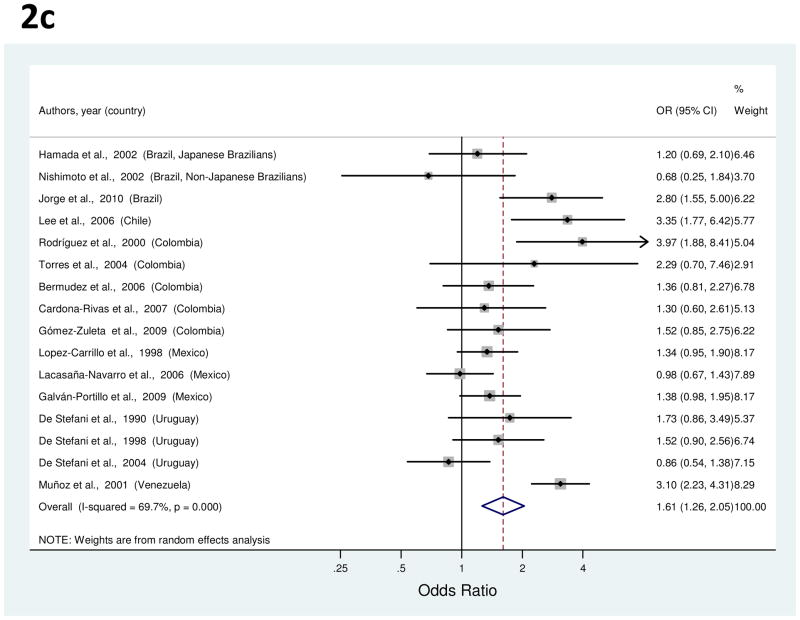
Figure 2.
a to c, random-effects estimates and 95% CIs of gastric cancer odds ratio (OR) associated with (A) education (highest vs. lowest level), (B) cigarette smoking (smokers vs. nonsmokers) and (C) alcohol use (drinkers vs. nondrinkers). Study-specific RRs are shown as squares, with the size of the symbol inversely proportional to the study-specific variance. Summary ORs are shown as diamonds, with the middle corresponding to the point estimate and the width representing the 95% CI.


