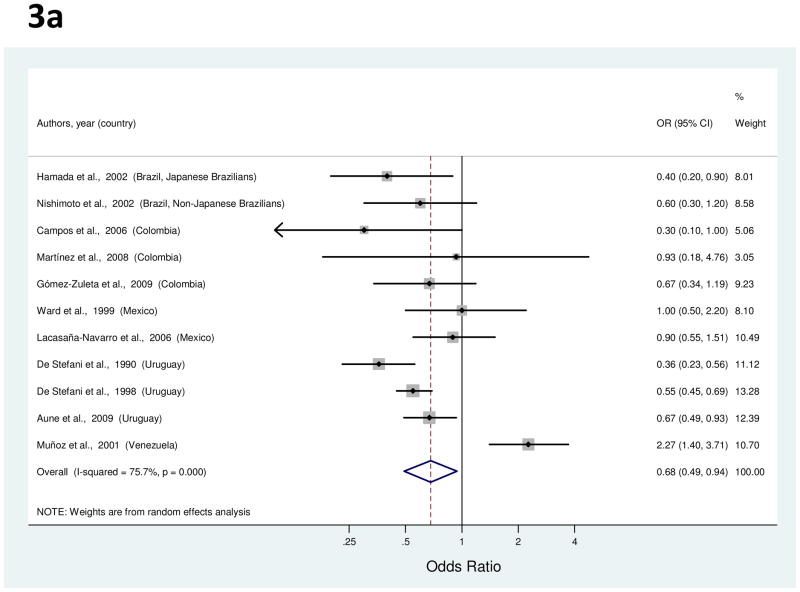
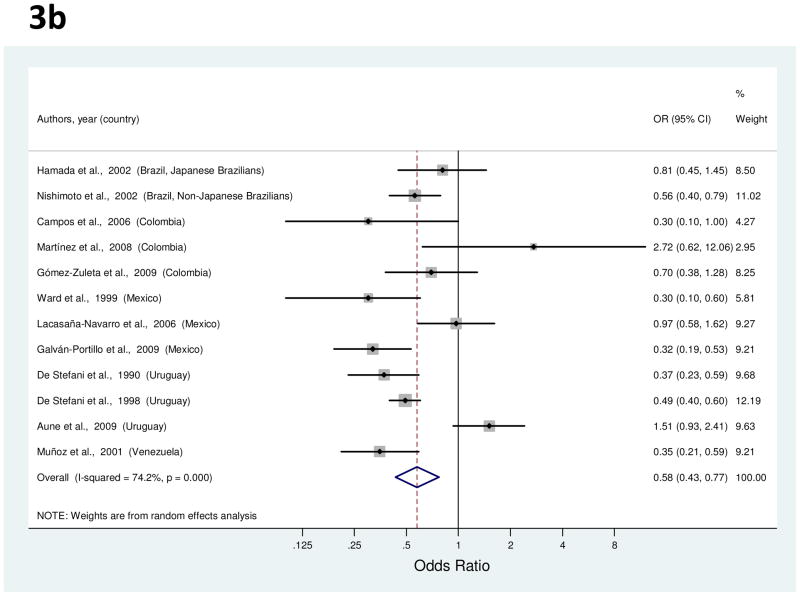
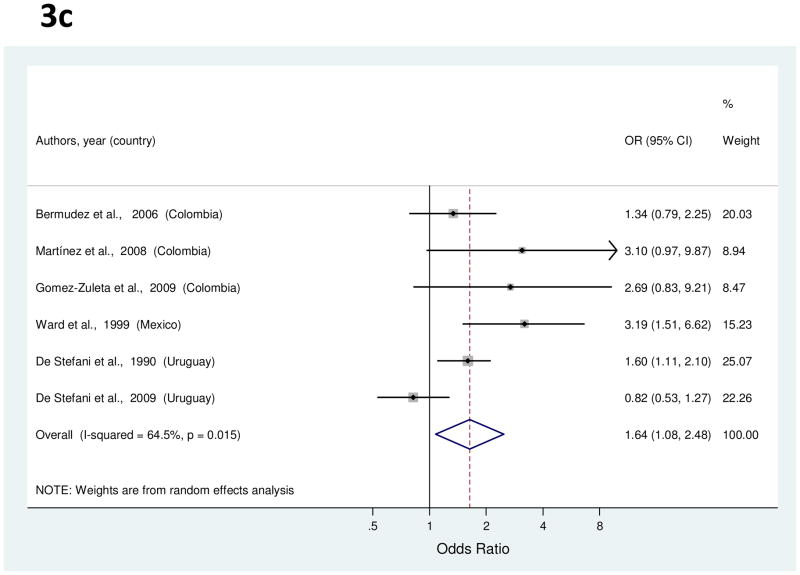
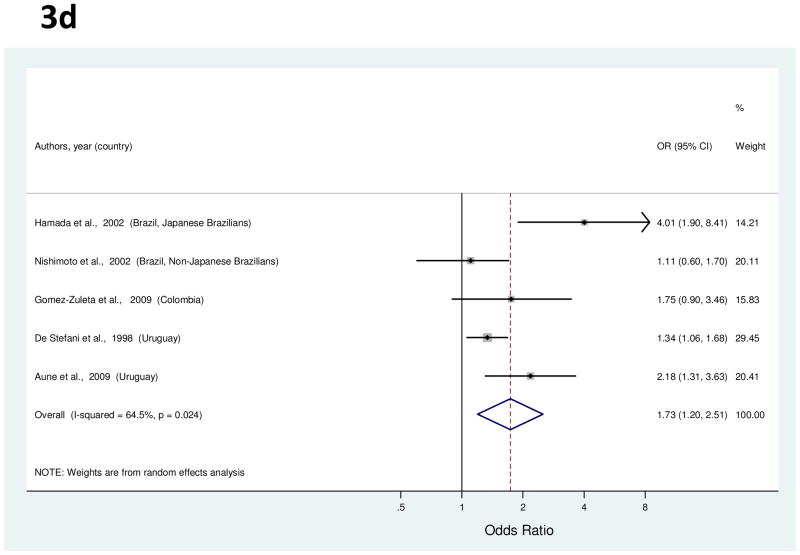
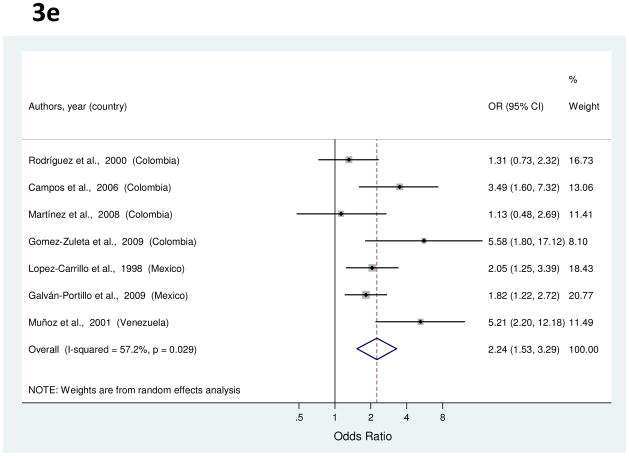
Figure 3.
a to e, random-effects estimates and 95% CIs of gastric cancer odds ratio (OR) associated with (a) total fruit consumption (highest vs. lowest category), (b) total vegetable consumption (highest vs. lowest category), (c) processed or salted meat consumption (highest vs. lowest category), (d) red meat consumption (highest vs. lowest category), and (e) Table salt use (yes vs. no). Study-specific RRs are shown as squares, with the size of the symbol inversely proportional to the study-specific variance. Summary ORs are shown as diamonds, with the middle corresponding to the point estimate and the width representing the 95% CI.

