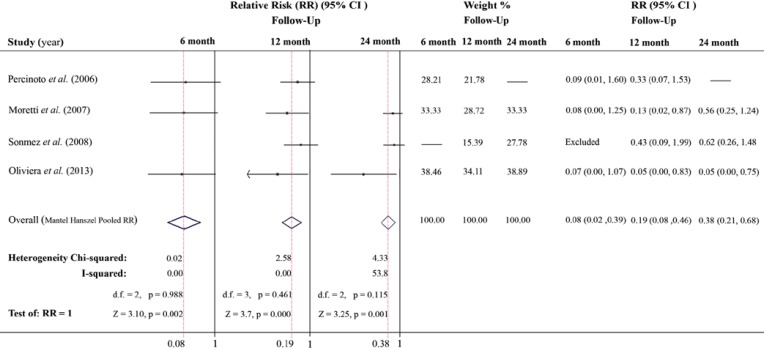
Figure 1.
Forest plots: Horizontal line for trials in each follow-up period illustrates the 95% CI; shorter line indicating higher precision of the trial. Diamonds are the pooled result, with horizontal tips signifying 95% CI, and the vertical tips (superimposed on vertical red section line) indicating pooled RR. The vertical line at 1 indicates no treatment outcome difference between the two experimental groups

