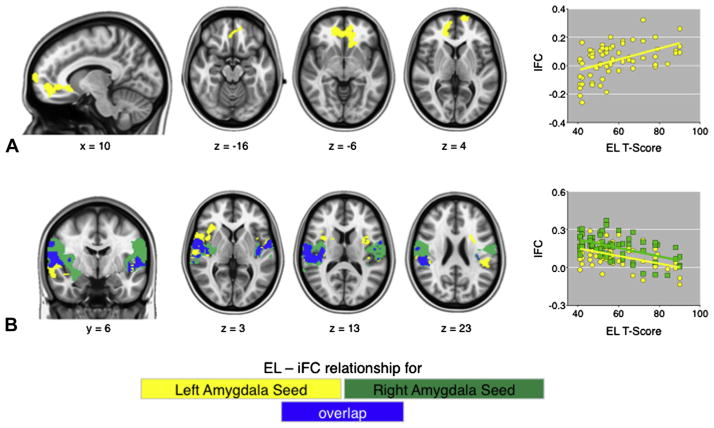
FIGURE 1.
Direction of the relationship between dimensional parent emotional lability (EL) ratings, co-varying for hyperactivity, and extracted time-series values for the significant clusters are shown in the scatter plots. Note: Images in row A demonstrate that increased EL is associated with increased amygdala connectivity (“iFC”) with the highlighted prefrontal regions, whereas row B shows that increased EL (“EL T-score”) is associated with decreased amygdala–insula/STG connectivity (“iFC”). Scatter plots address EL T-scores (x-axis) versus amygdala correlations (y-axis).

