Extended Data Fig. 10.
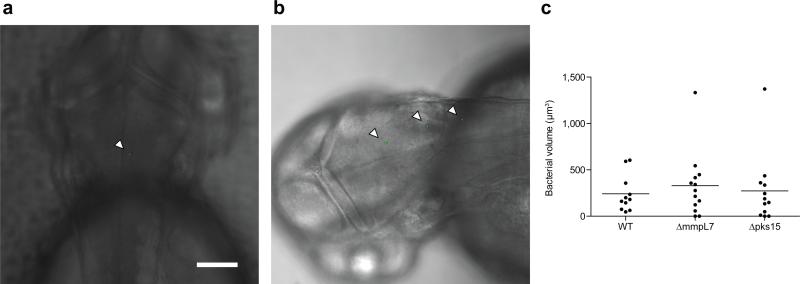
Infectivity Assay. a-b, Representative 5 HPI images from Figure 4d following HBV infection with (a) one or (b) three M. marinum. Scale bar = 100 μm. Ns for fish represented in (a) and (b) (i.e. those found to be infected with one to three bacteria) are presented in Figure 4d (18, 22, 28, 28, 28, 28, 22, 22 for the respective conditions as specified in the figure). c, Mean bacterial burdens 5 HPI HBV infection with 1-3 wild-type (WT), ΔmmpL7, or Δpks15 M. marinum.

