
. 2014 Jan-Mar;3(1):13–15. doi: 10.4103/2278-330X.126503
Copyright: © South Asian Journal of Cancer
This is an open-access article distributed under the terms of the Creative Commons Attribution-Noncommercial-Share Alike 3.0 Unported, which permits unrestricted use, distribution, and reproduction in any medium, provided the original work is properly cited.
Figure 1.
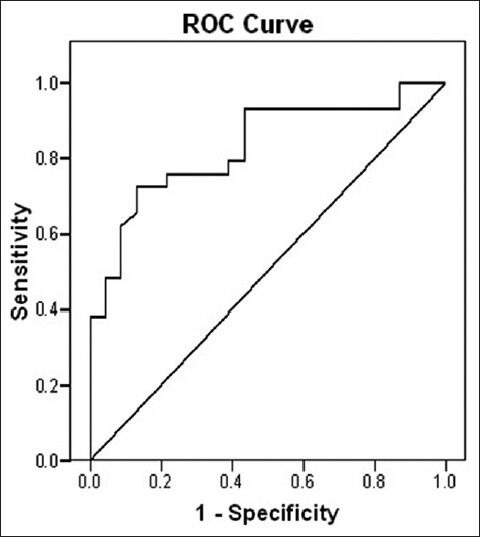
ROC curve showing specificity and sensitivity of V5 ipsi