Figure 3.

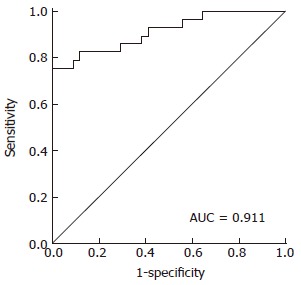
Receiver operating characteristic curve. Receiver operating characteristic (ROC) analysis was performed to evaluate the diagnostic power of the model. The area under the ROC curve value was 0.911.

Receiver operating characteristic curve. Receiver operating characteristic (ROC) analysis was performed to evaluate the diagnostic power of the model. The area under the ROC curve value was 0.911.