
Figure 3.
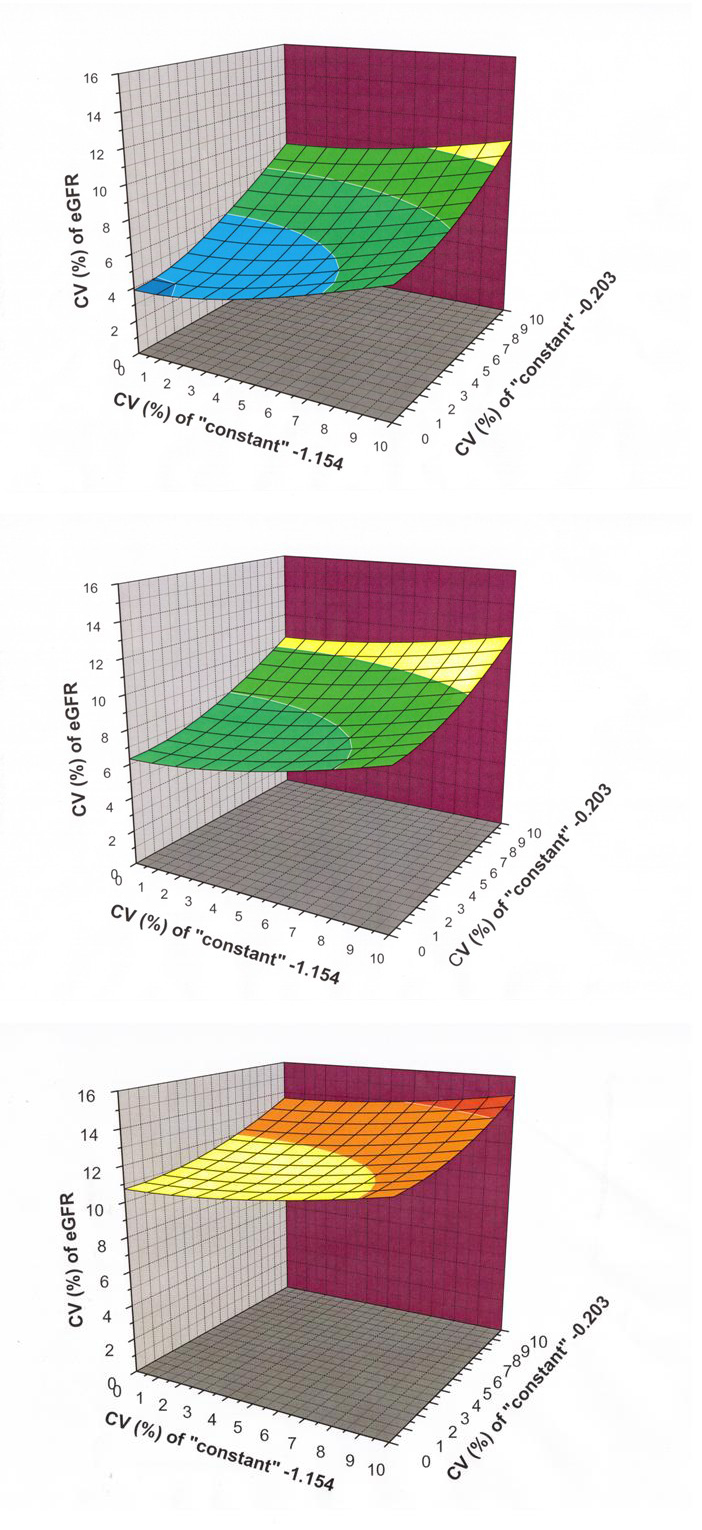
Three dimensional graphs demonstrating the contribution which uncertainty in the empirically derived ‘constants’ may have on the combined standard uncertainty of eGFR calculated using the MDRD equation. Using a fixed serum creatinine of 150 μmol/L with a standard uncertainty of 5.0 μmol/L, proportional uncertainty estimates (CV%) for eGFR are shown using hypothetical standard uncertainty values for the ‘constant’ 175 at 0%, 5% and 10% of its stated value, in association with the ‘constants’ −1.154 and −0.203 at standard uncertainties ranging from 0% to 10% of their stated values. Figure 3(a) shows a graph with the ‘constant’ 175 assumed to have zero uncertainty, with the other two ‘constants’ taking proportional uncertainty values as indicated. In a similar manner, Figure 3(b) and Figure 3(c) show how the eGFR proportional combined standard uncertainty changes when the ‘constant’ 175 is given standard uncertainty values of 5% and 10%.