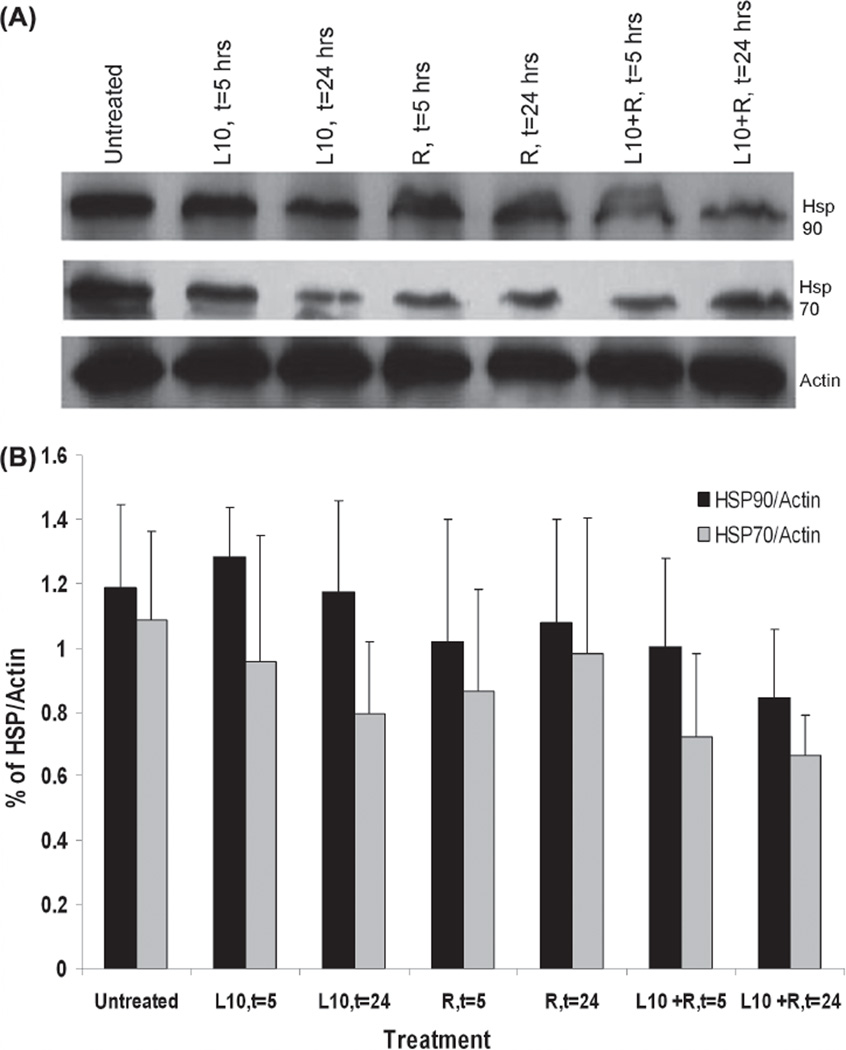
Figure 3.
Immunoblot analysis of Hsp90 and Hsp70 in Gli36 cells in vitro. (A) Representative Western blot of in vitro Hsp90 and Hsp70 levels after 1 h pretreatment with 0.3 mg/ml Pluronic L10 (L10), 3 Gy radiation only (R), and combined treatment (L10 + R) at different time points post-treatment (t = 5, t = 24 h). (B) Hsp expression at different time points was normalized versus actin. Each peak is the mean of three independent measurements ± SD.

