Table 1.
Epidemiological profile of selected diseases in Gujarat reported by IDSP during a 7-year period (2005–2011)
| Temporal analysis | |||||
|---|---|---|---|---|---|
|
|
|||||
| Diseases reported by IDSP | Total reported cases 2005–2011 | Average reported case rates/100,000 population/year | Urban proportion over 7 years (%) | Ratio of 2011:2005 cases | Trendline |
| Enteric fever | 112,884 | 26.71 | 36.80 | 2.02 |
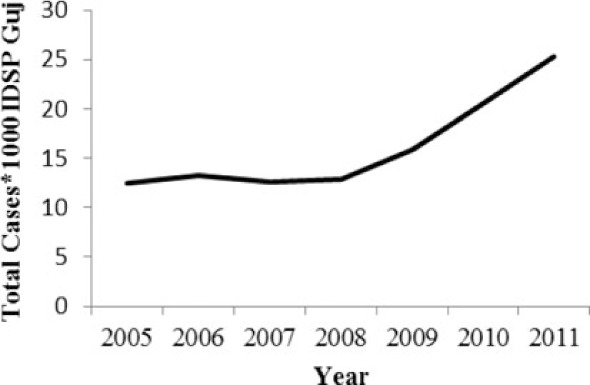
|
| Hepatitis | 104,722 | 24.76 | 51.07 | 2.20 |
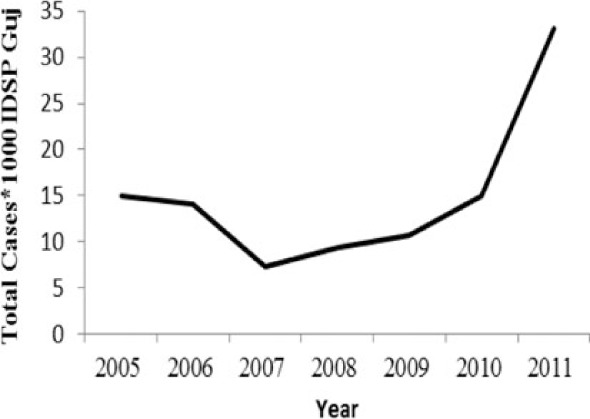
|
| Cholera | 1,560 | 0.40 | 83.42 | 1.80 |
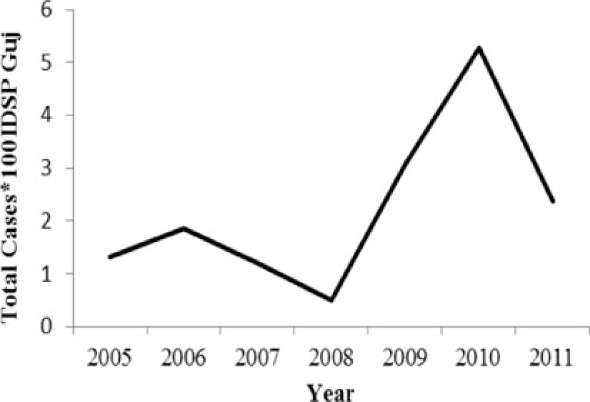
|
| Dengue | 10,403 | 2.46 | 75.56 | 2.15 |
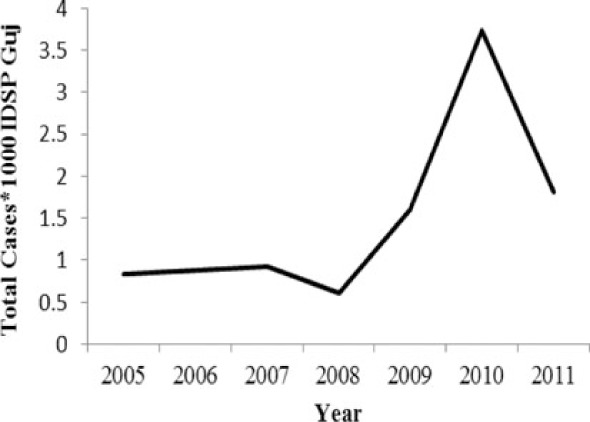
|
| Chikungunya# | 620 | 0.51 | 68.73 | – |
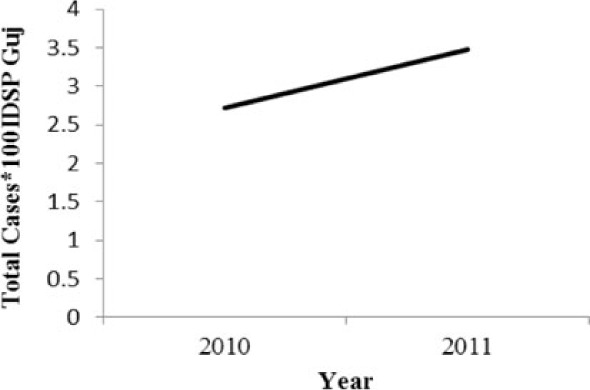
|
| Measles | 7,053 | 1.67 | 38.40 | 3.62 |
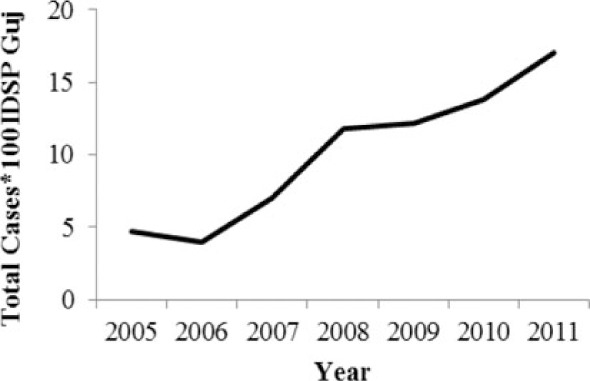
|
| Diphtheria | 1,461 | 0.35 | 89.12 | 0.60 |
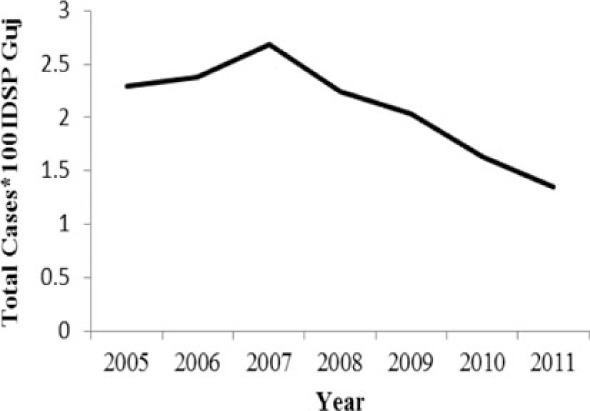
|
Data available for 2010–2011.
