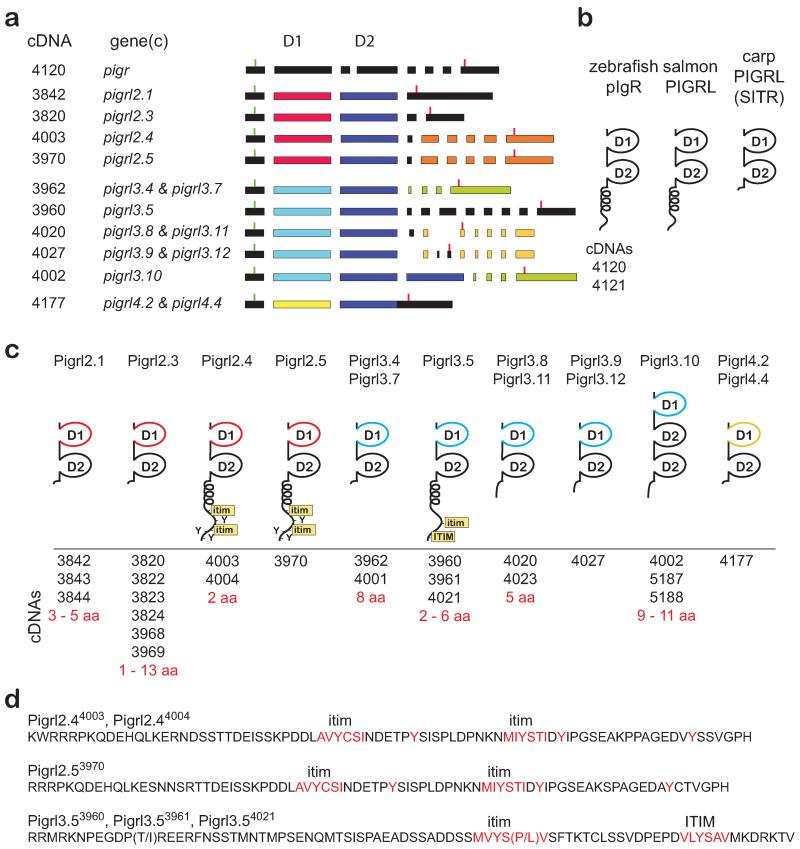
Fig. 5. PIGRL transcripts, exons and predicted proteins.
(a) Transcript (cDNA) numbers are listed on the left, adjacent to the gene that best matches the transcript. Exons are represented by rectangles. The position of start codons and stop codons are indicated by green and red vertical lines, respectively. D1 domain exons are color-coded as in Figures 2 and 3. Other exons are color-coded to indicate nearly identical sequences. (b) Schematic representations of zebrafish pIgR and PIGRL sequences from salmon and carp (Ribeiro et al. 2011;Tadiso et al. 2011). (c) Schematic representation of PIGRL proteins deduced from transcripts. Positioning of D1, D2, transmembrane (TM), cytoplasmic tyrosines (Y), immunoreceptor tyrosine-based inhibition motif (ITIM) and ITIM-like (itim) sequences are indicated. Transcripts that best match the gene shown are listed below the protein structure and the amino acid (aa) variation between the proteins encoded by these transcripts indicated. (d) Peptide sequences corresponding to cytoplasmic domains encoded by three PIGRL genes are listed. Variable residues encoded by polymorphic transcripts are in parentheses. Full-length protein sequences are available in Electronic Supplementary Fig. S5. Sequences have been deposited in GenBank with accession numbers KF932324 – KF932349.

