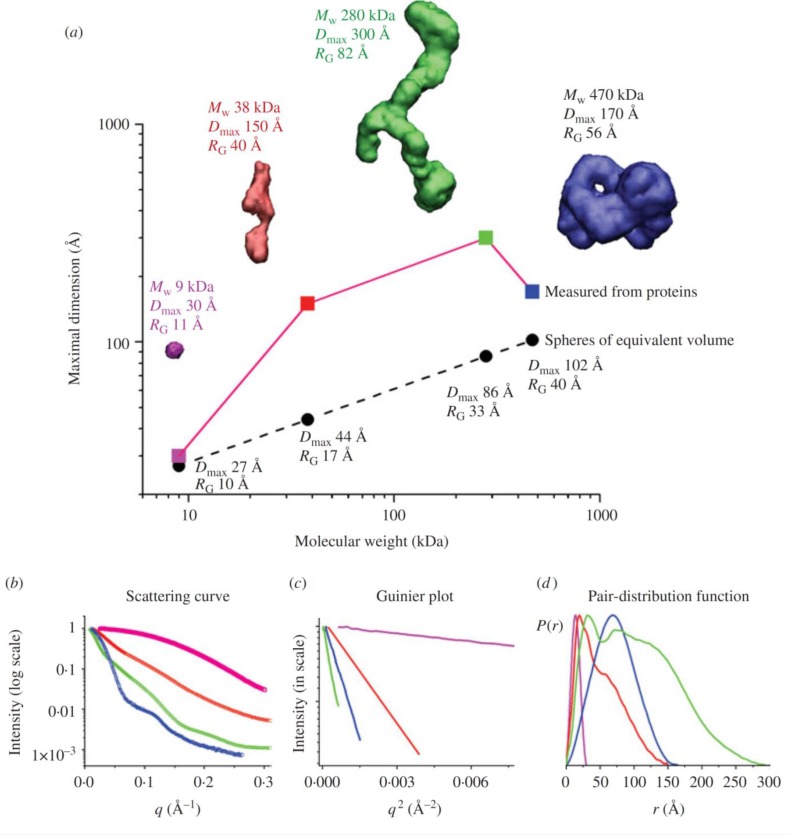
Figure 4.
Originally from SAXS combined with crystallography and computation [3]. This figure depicts the experimental SAXS curves and parameters measured for Pyrococcus furiosis PF1282 rubredoxin (magenta), a ‘designed’ scaffoldin protein S4 (red), a ‘designed’ minicellulosome containing three catalytic subunits (green), and the DNA-dependent protein kinase (blue). (a) Dmax of the scattering particle is a simple function of molecular weight for perfect spheres, but not for proteins that adopt different shapes. Envelopes correspond to ab-initio models calculated from experimental curves using GASBOR. (b) The experimental scattering curves for each protein show that the intensity of scattering falls more slowly for rebredoxin (RG 11 Å ; magenta) than the minicellulosome (RG 82 Å; green). (c) The linear region of the Guinier plot, from which RG and I(0) can be derived, is a function of the RG. (d) Each protein has both a substantially different Dmax as well as pair-distribution function, reflecting the different atomic arrangements.

