
Table 2.
Comparison of in silico probability of xylotriose product release and in vitro relative activity depending on the residue at position 116. The last row displays in vitro relative activity, derived from the catalytic efficiency kcat / KM (app) of each enzyme in comparison to the activity of the wild type enzyme taken as reference (100%) from Table 3.
| Enzyme name | Residue at position 116 | Side-chain structure (X stands for amino acid main chain) | Amino acid volume (Å3) [51] | In silico probability of xylotriose product releasing | In vitro relative activity (see Table 3) |
|---|---|---|---|---|---|
| Tx-xyl | Ile | 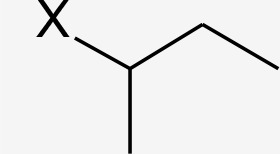 |
170 | 75% | 100% |
| Tx-xyl-A | Ala | 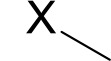 |
90 | 10% | 12.3 ± 3.3% |
| Tx-xyl-C | Cys |  |
109 | 50% | 108.3 ± 21.1% |
| Tx-xyl-G | Gly | 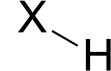 |
60 | 0% | 0.4 ± 0.1% |
| Tx-xyl-S | Ser |  |
89 | 0% | 1.4 ± 0.5% |
| Tx-xyl-T | Thr | 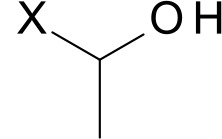 |
116 | 33% | 12.7 ± 3.7% |